在之前的文章中总结过内存取证的相关知识,本次文章是对之前的内容进行的补充和汇总。
info
本文来源于我的笔记项目中,后续有更新内容可见 内存取证.md
内存获取
这个步骤是从目标机器中导出内存。完整的内存数据包括两部分: 物理内存数据和页面交换文件数据. 物理内存通常是一个特殊的内核对象, 比如, 在 Windows 系统中, 物理内存是内核内存区对象, 即 \\Device\\PhysicalMemory; 在 Unix/Linux 系统中, 物理内存为 /dev/mem 和 /dev/kmem. 只要能读取该内核对象, 就能获取物理内存数据.
你可以在物理机上使用工具比如 Win32dd/Win64dd, Memoryze, DumpIt, FastDump 。然而在虚拟机上,获取内存是很容易的,你可以暂停 VM 并取出 .vmem 文件。
基于硬件的内存获取
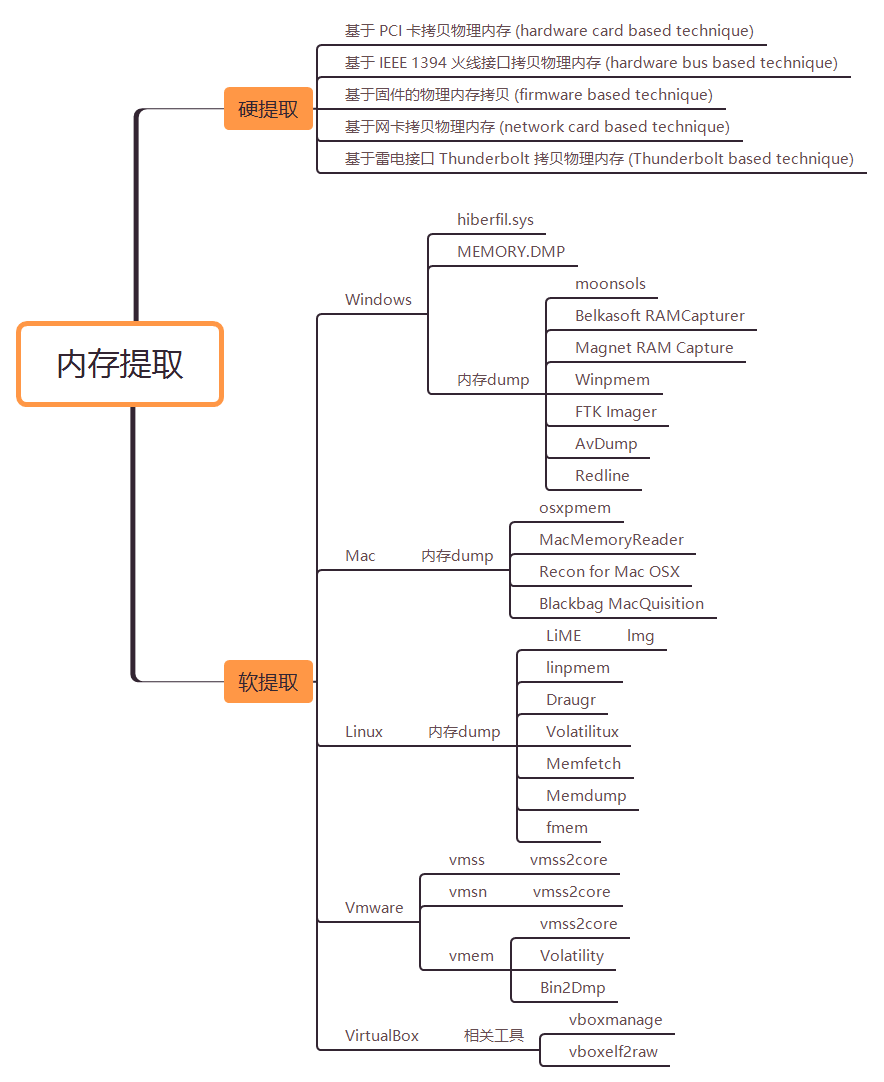
根据所面向的硬件体系和操作系统的不同,可以分为以下几种
面向 Intel 架构桌面操作系统的内存获取
此类基于硬件的内存获取方法主要通过插入硬件卡, 利用 DMA(direct memory access, 直接内存访问) 指令去获取物理内存的拷贝. 在拷贝物理内存时, 目标系统的 CPU 将暂停, 以避免因操作系统的执行而改变内存数据. 目前有以下几种类型的硬件卡:
- 基于 PCI 卡拷贝物理内存 (hardware card based technique)
- 基于 IEEE 1394 火线接口拷贝物理内存 (hardware bus based technique)
- 基于固件的物理内存拷贝 (firmware based technique), 利用 PCI 网卡中的 SMM(system management mode, 系统管理模式) 固件获取物理内存和 CPU 寄存器内容;
- 基于网卡拷贝物理内存 (network card based technique), 比如, 利用网卡的 NDIS(network driver interface specification, 网络驱动程序接口规范) 来获取物理内存;
- 基于雷电接口 Thunderbolt 拷贝物理内存 (Thunderbolt based technique)
此类方法的优点是:
- 在基于 Intel 架构的操作系统 (Windows,Linux,Mac OS 等) 中, 都可以利用该方法获取物理内存;
- 采用 DMA 方式能够在不干扰操作系统和 CPU 的情况下, 较为准确地获取物理内存拷贝.
其缺点是:
- 如攻击者对主板上的北桥芯片进行重新编程, 则很容易欺骗此类方法;
- 早期的 PCI 硬件卡须事先插入主板中, 这对于遭受实时攻击的系统来说是不现实的;
- 新版 BIOS 对 SMM 模式进行锁定, 限制了利用固件获取物理内存的应用;
- 如果攻击者对 NDIS 库进行劫持, 就能篡改通过网卡传送的物理内存数据;
- 只能获取物理内存 RAM, 不能获取页面交换文件.
面向 ARM 结构智能终端操作系统的内存获取
面向智能终端的硬件获取方法主要通过硬件与终端设备相连接, 以获取智能终端设备的内存数据. 目前, 基于硬件的内存获取方法主要有两种:
基于软件的内存获取
Windows
相关工具
- moonsols - moonsols 可以处理休眠文件(Hiberfil.sys),crashdump 文件和 raw memory dump 文件,crashdump 可以被 winDBG 加载进行分析,所以最终要转化为 crashdump 文件。
- Dumpit - 一款 windows 内存镜像取证工具。利用它我们可以轻松地将一个系统的完整内存镜像下来,并用于后续的调查取证工作
- Belkasoft RAMCapturer
- Magnet RAM Capture
- Winpmem
- FTK Imager
- Elcomsoft System Recovery
- AvDump - 提取指定 pid 的内存
1
|
.\avdump64.exe --pid <pid> --exception_ptr 0 --thread_id 0 --dump_level 1 --dump_file lsass.dmp
|
- Redline
hiberfil.sys
休眠 (hibernate) 是指系统将内存中的数据全部转储到硬盘上一个休眠文件中, 然后切断对所有设备的供电, 并在下次开机时, 系统会将硬盘上的休眠文件内容直接读入内存, 并恢复到休眠之前的状态. 由于休眠文件中保存的是休眠时刻系统的内存记录, 因此, 系统休眠文件也成了获取内存数据的一种方式.
在 Windows 系统中, 当系统进入节能休眠模式时, 会自动生成休眠文件 Hiberfil.sys 且存放在 Windows 系统根目录下.
在 Linux 系统中, 休眠文件保存在 swap 分区中. 在 Mac OS 系统中, 休眠文件保存在 /var/vm/sleepimage 中. 基于系统休眠文件的内存获取方法, 就是利用操作系统这种机制来获取内存数据.
该方法尽管实现简单, 但存在如下缺陷:
- 由于系统休眠时保存的物理内存 RAM 中的数据, 未包括页面交换文件数据, 导致无法获取全部内存数据;
- 需要与物理内存 RAM 大小相同的硬盘空间, 以存储休眠文件;
- 不同操作系统的休眠文件格式未知, 且压缩存放, 这给取证分析该文件带来了困难;
- 该方法除了需要 BIOS 支持以外, 还需要外围硬件设备能够支持节电状态, 且这些设备驱动必须能够接收电源管理指令.
如果计算机在挂载加密分区时进入休眠状态,则 OTFE 密钥可以直接存储在系统的休眠文件中。
在某些情况下,存在 hiberfil.sys,但尚未使用。最好检查 hiberfil.sys 是否为空(全零字节)
1
|
cat hiberfil.sys | tr -d '\0' | read -n 1 || echo "All null bytes"
|
将 hiberfil.sys 转换为 dmp 格式
-
volatility
1
2
3
4
|
volatility_standalone.exe -f d:\hiberfilsys.copy imageinfo
volatility_standalone.exe -f d:\hiberfilsys.copy --profile=Win7SP1x64 hibinfo
volatility_standalone.exe -f d:\hiberfilsys.copy imagecopy --profile=Win7SP1x64 -O hiber.raw
volatility_standalone.exe -f hiberfil.raw --profile=Win7SP1x64 raw2dmp -O hiberfil.dmp
|
-
Hibr2Dmp
1
|
Hibr2Dmp.exe hiberfil.sys hiberfil.dmp
|
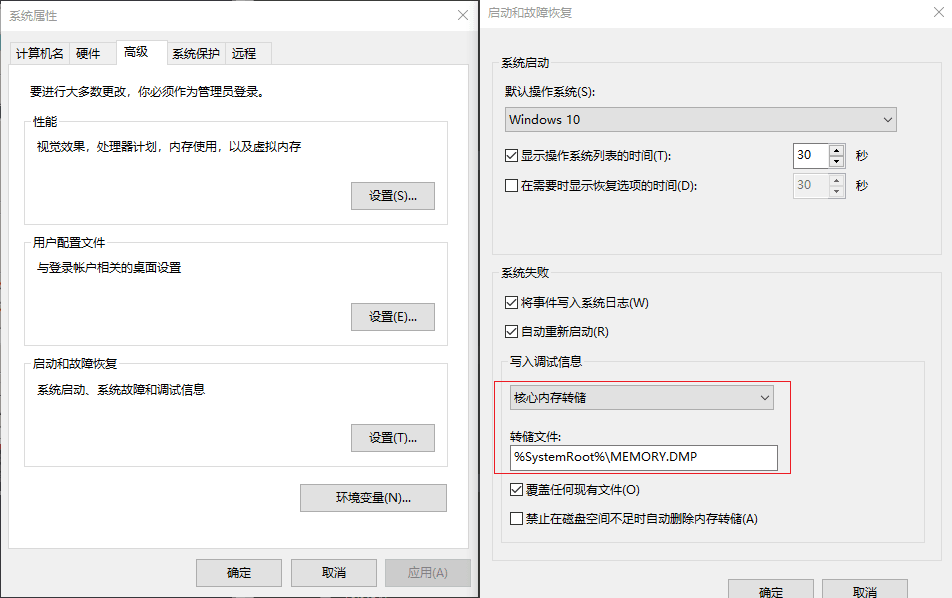
MEMORY.DMP
MEMORY.DMP 文件是 Windows 操作系统中的内存转储文件,当 Windows 发生错误蓝屏的时候,系统将当前内存(含虚拟内存)中的数据直接写到文件中去,方便定位故障原因。
MAX OSX
相关工具
- osxpmem
1
2
3
4
|
sudo chown -R root:wheel pmem.kext
sudo chown chmod -R 755 pmem.kext
sudo kextload -v pmem.kext
./osxpmem -f raw mem.bin
|
- MacMemoryReader
- Recon for Mac OSX
- Blackbag MacQuisition
Linux
相关工具
- 504ensicsLabs/LiME - LiME 是一个用于获取各种取证数据的命令行工具。
 1
 2
 3
 4
 5
 6
 7
 8
 9
10
11
|
# 编译 LiME
yum install -y gcc make gcc-c++
yum install -y kernel-devel
ls -lisa /usr/src/kernels/
git clone https://github.com/504ensicslabs/lime
cd lime/src
make    # 如果编译失败有可能是 /lib/modules/xxx/ 的 build 链接错误,重新连接即可

# 在这个过程的最后,它被编译成一个可下载的 Linux 版本的内核对象。使用 insmod 命令运行 LiME。此步骤将获取 LiME 格式的内存样本,现在我们已经准备好接收内存镜像了。我想在 usb 上打印,所以我给出了 usb 内存的路径。我必须在这里提醒你一些事情。存储器图像的尺寸并不小,所以要确保在你要拍摄图像的设备中有足够的空间,最后,你可以使用 rmmod 删除模块。
insmod ./lime-3.10.0-1062.18.1.el7.x86_64.ko path=/media/usbaaa/ESD-USB/linux64.mem format=raw
rmmod lime
|
- halpomeranz/lmg - 配合 LiME 获取镜像,简化操作
1
|
将 lmg-master 内文件放入 LiME 的 src 文件夹,运行 ./lmg 搞定。
|
- linpmem
- Draugr
- Volatilitux
- Memfetch
- Memdump
- fmem
 1
 2
 3
 4
 5
 6
 7
 8
 9
10
11
12
13
14
15
16
17
18
19
20
21
|
git clone https://github.com/NateBrune/fmem
cd fmem

    # ubuntu install dwarfdump
    apt-get install -y dwarfdump

    # centos install dwarfdump
    yum install -y gcc make gcc-c++
    yum install -y elfutils-devel
    yum install -y kernel-devel
    wget https://www.prevanders.net/libdwarf-20201201.tar.gz
    tar -zxvf libdwarf-20201201.tar.gz
    cd libdwarf-20201201
    ./configure
    make
    make install
    cd ../

make    # 如果编译失败有可能是 /lib/modules/xxx/ 的 build 链接错误,重新连接即可
./run.sh
dd if=/dev/fmem of=/root/cyq.vmem bs=1MB count=2048    # 将内存里的数据拷贝到 root 目录下的 cyq.vmem 文件
|
Vmware
VMWare 虚拟机在暂停或挂起时, 内存状态信息会保存在以. Vmss 为扩展名的文件中; 在建立系统快照时, 包括内存在内的系统状态信息会保存在以. Vmsn 为扩展名的文件中; 而虚拟客户机的所有内存信息会保存在以. Vmem 为扩展名的文件中
相关工具
VirtualBox
相关工具
- vboxmanage + vboxelf2raw.sh + Volatility
1
2
3
4
|
vboxmanage debugvm "win7test" dumpvmcore --filename testvbox.elf
# VirtualBox 内存转储采用 ELF 格式,其中 load1 段保存原始内存转储。
./vboxelf2raw.sh testvbox.elf
volatility_standalone.exe -f testvbox.elf.raw --profile=Win7SP1x64 raw2dmp -O testvbox.dmp
|
内存分析
内存取证工具
- Volatility - Volatility Framwork 是一款开源的基于 Python 开发的内存分析框架,它自带的分析插件支持分析内存镜像中所保留的历史网络连接信息、历史进程、历史命令记录等等。
- Elcomsoft Forensic Disk Decryptor - 即时访问保存在加密的 BitLocker,FileVault 2,PGP,TrueCrypt 和 VeraCrypt 存储中的数据。该工具从 RAM 捕获数据,休眠和页面文件中提取加密密钥,或使用纯文本密码或托管密钥来解密存储在加密容器中的文件和文件夹,或者将加密卷装载为新的驱动器号,以便进行实时访问。
- gleeda/memtriage - 集成了 Winpmem 和 Volatility 的工具
- WinHex
- 取证大师
- makomk/aeskeyfind - 该工具用于在内存转储中寻找 AES 密钥
Volatility
简介
Volatility 是一个用于事件响应和恶意软件分析的开源内存取证框架。它是用 Python 编写的,支持 Microsoft Windows,macOS 和 Linux,volatility 框架是一个完全开放的工具集合,在 GNU 通用许可证下用 Python 实现,用于从易失性存储器(RAM)样本中提取数字镜像。提取技术完全独立于被取证的系统而执行,但可以查看到系统运行时的状态信息。该框架旨在向人们介绍从内存样本中提取的数字镜像相关的技术,并为进一步研究该领域提供一个平台,它可以分析 .raw、.vmem、.img 后缀的文件。
支持原始数据转储(Raw Dump)、崩溃转储(Crash Dump)、休眠文件及各种其它格式,甚至可以支持多个格式之间的转换。
安装及维护
Ubuntu 下安装
1
2
3
4
5
6
7
8
9
10
11
12
13
14
15
16
|
apt-get install -y volatility
apt-get install -y python-dev
apt-get install -y python3-dev
python2 -m pip install distorm3 yara pycrypto openpyxl ujson pil
python2 -m pip install Crypto
python2 -m pip install pycryptodome
python2 -m pip install pytz
python2 -m pip install Pillow
python2 -m pip install yara-python
cd /tmp
git clone https://github.com/gdabah/distorm
cd distorm
python2 -m pip install distorm3
volatility --info
|
kali 下安装
 1
 2
 3
 4
 5
 6
 7
 8
 9
10
11
12
13
14
15
16
17
18
19
20
21
22
23
24
25
|
cd /tmp
wget https://bootstrap.pypa.io/get-pip.py
python2 get-pip.py
python2 -m pip install --upgrade pip
apt-get install -y python-dev
apt-get install -y python3-dev
python2 -m pip install distorm3 yara pycrypto openpyxl ujson pil
python2 -m pip install Crypto
python2 -m pip install pycryptodome
python2 -m pip install pytz
python2 -m pip install Pillow
python2 -m pip install yara-python
cd /tmp
git clone https://github.com/gdabah/distorm
cd distorm
python2 -m pip install distorm3
cd
git clone https://github.com/volatilityfoundation/volatility.git
cd volatility
python setup.py build
python setup.py install
python vol.py --info
|
centos 下安装
1
2
3
4
5
6
7
8
9
10
11
12
13
14
15
16
17
18
19
20
21
22
|
yum install -y kernel-devel
yum install -y make gcc gcc-c++
yum groupinstall -y "Development Tools"
yum install -y yum-utils
yum install -y pcre-devel libpcre++-devel python-devel pycrypto
pip install --upgrade pip
python2 -m pip install distorm3==3.4.4
python2 -m pip install yara pycrypto openpyxl ujson pil
python2 -m pip install Crypto
python2 -m pip install pycryptodome
python2 -m pip install pytz
python2 -m pip install Pillow
python2 -m pip install yara-python
cd
git clone https://github.com/volatilityfoundation/volatility.git
cd volatility
python setup.py build
python setup.py install
python vol.py --info
|
windows 下安装
直接访问官网下载二进制文件 https://www.volatilityfoundation.org/releases
使用
基本用法
1
2
3
4
5
6
7
8
9
10
11
|
volatility -f [image] --profile=[profile] [plugin]
eg:volatility -f /opt/test.vmem -profile=Win7SP1x86 pslist
-h # 查看相关参数及帮助说明
-info # 查看相关模块名称及支持的 Windows 版本
-f # 指定要打开的内存镜像文件及路径
-d # 开启调试模式
-v # 开启显示详细信息模式 (verbose)
# 如果是从 github 下载的
python vol.py -f [image] ‐-profile=[profile] [plugin]
|
Volatility 支持的插件列表
1
2
3
4
5
6
7
8
9
10
11
12
13
14
15
16
17
18
19
20
21
22
23
24
25
26
27
28
29
30
31
32
33
34
35
36
37
38
39
40
41
42
43
44
45
46
47
48
49
50
51
52
53
54
55
56
57
58
59
60
61
62
63
64
65
66
67
68
69
70
71
72
73
74
75
76
77
78
79
80
81
82
83
84
85
86
87
88
89
90
91
92
93
94
95
96
97
98
99
100
101
102
103
104
105
106
107
108
109
110
111
112
113
|
amcache # 查看 AmCache 应用程序痕迹信息
apihooks # 检测内核及进程的内存空间中的 API hook
atoms # 列出会话及窗口站 atom 表
atomscan # Atom 表的池扫描(Pool scanner)
auditpol # 列出注册表 HKLM\SECURITY\Policy\PolAdtEv 的审计策略信息
bigpools # 使用 BigPagePoolScanner 转储大分页池(big page pools)
bioskbd # 从实时模式内存中读取键盘缓冲数据(早期电脑可以读取出 BIOS 开机密码)
cachedump # 获取内存中缓存的域帐号的密码哈希
callbacks # 打印全系统通知例程
clipboard # 提取 Windows 剪贴板中的内容
cmdline # 显示进程命令行参数
cmdscan # 提取执行的命令行历史记录(扫描_COMMAND_HISTORY 信息)
connections # 打印系统打开的网络连接(仅支持 Windows XP 和 2003)
connscan # 打印 TCP 连接信息
consoles # 提取执行的命令行历史记录(扫描_CONSOLE_INFORMATION 信息)
crashinfo # 提取崩溃转储信息
deskscan # tagDESKTOP 池扫描(Poolscaner)
devicetree # 显示设备树信息
dlldump # 从进程地址空间转储动态链接库
dlllist # 打印每个进程加载的动态链接库列表
driverirp # IRP hook 驱动检测
drivermodule # 关联驱动对象至内核模块
driverscan # 驱动对象池扫描
dumpcerts # 提取 RAS 私钥及 SSL 公钥
dumpfiles # 提取内存中映射或缓存的文件
dumpregistry # 转储内存中注册表信息至磁盘
editbox # 查看 Edit 编辑控件信息 (Listbox 正在实验中)
envars # 显示进程的环境变量
eventhooks # 打印 Windows 事件 hook 详细信息
evtlogs # 提取 Windows 事件日志(仅支持 XP/2003)
filescan # 提取文件对象(file objects)池信息
gahti # 转储用户句柄(handle)类型信息
gditimers # 打印已安装的 GDI 计时器 (timers) 及回调(callbacks)
gdt # 显示全局描述符表(Global Descriptor Table)
getservicesids # 获取注册表中的服务名称并返回 SID 信息
getsids # 打印每个进程的 SID 信息
handles # 打印每个进程打开的句柄的列表
hashdump # 转储内存中的 Windows 帐户密码哈希(LM/NTLM)
hibinfo # 转储休眠文件信息
hivedump # 打印注册表配置单元信息
hivelist # 打印注册表配置单元列表
hivescan # 注册表配置单元池扫描
hpakextract # 从 HPAK 文件(Fast Dump 格式)提取物理内存数据
hpakinfo # 查看 HPAK 文件属性及相关信息
idt # 显示中断描述符表(Interrupt Descriptor Table)
iehistory # 重建 IE 缓存及访问历史记录
imagecopy # 将物理地址空间导出原生 DD 镜像文件
imageinfo # 查看 / 识别镜像信息
impscan # 扫描对导入函数的调用
joblinks # 打印进程任务链接信息
kdbgscan # 搜索和转储潜在 KDBG 值
kpcrscan # 搜索和转储潜在 KPCR 值
ldrmodules # 检测未链接的动态链接 DLL
lsadump # 从注册表中提取 LSA 密钥信息(已解密)
machoinfo # 转储 Mach-O 文件格式信息
malfind # 查找隐藏的和插入的代码
mbrparser # 扫描并解析潜在的主引导记录(MBR)
memdump # 转储进程的可寻址内存
memmap # 打印内存映射
messagehooks # 桌面和窗口消息钩子的线程列表
mftparser # 扫描并解析潜在的 MFT 条目
moddump # 转储内核驱动程序到可执行文件的示例
modscan # 内核模块池扫描
modules # 打印加载模块的列表
multiscan # 批量扫描各种对象
mutantscan # 对互斥对象池扫描
notepad # 查看记事本当前显示的文本
objtypescan # 扫描窗口对象类型对象
patcher # 基于页面扫描的补丁程序内存
poolpeek # 可配置的池扫描器插件
printkey # 打印注册表项及其子项和值
privs # 显示进程权限
procdump # 进程转储到一个可执行文件示例
pslist # 按照 EPROCESS 列表打印所有正在运行的进程
psscan # 进程对象池扫描
pstree # 以树型方式打印进程列表
psxview # 查找带有隐藏进程的所有进程列表
qemuinfo # 转储 Qemu 信息
raw2dmp # 将物理内存原生数据转换为 windbg 崩溃转储格式
screenshot # 基于 GDI Windows 的虚拟屏幕截图保存
servicediff # Windows 服务列表(ala Plugx)
sessions # _MM_SESSION_SPACE 的详细信息列表(用户登录会话)
shellbags # 打印 Shellbags 信息
shimcache # 解析应用程序兼容性 Shim 缓存注册表项
shutdowntime # 从内存中的注册表信息获取机器关机时间
sockets # 打印已打开套接字列表
sockscan # TCP 套接字对象池扫描
ssdt # 显示 SSDT 条目
strings # 物理到虚拟地址的偏移匹配(需要一些时间,带详细信息)
svcscan # indows 服务列表扫描
symlinkscan # 符号链接对象池扫描
thrdscan # 线程对象池扫描
threads # 调查_ETHREAD 和_KTHREADs
timeliner # 创建内存中的各种痕迹信息的时间线
timers # 打印内核计时器及关联模块的 DPC
truecryptmaster # 恢复 TrueCrypt 7.1a 主密钥
truecryptpassphrase # 查找并提取 TrueCrypt 密码
truecryptsummary # TrueCrypt 摘要信息
unloadedmodules # 打印卸载的模块信息列表
userassist # 打印注册表中 UserAssist 相关信息
userhandles # 转储用户句柄表
vaddump # 转储 VAD 数据为文件
vadinfo # 转储 VAD 信息
vadtree # 以树形方式显示 VAD 树信息
vadwalk # 显示遍历 VAD 树
vboxinfo # 转储 Virtualbox 信息(虚拟机)
verinfo # 打印 PE 镜像中的版本信息
vmwareinfo # 转储 VMware VMSS/VMSN 信息
volshell # 内存镜像中的 shell
windows # 打印桌面窗口(详细信息)
wintree # Z 顺序打印桌面窗口树
wndscan # 池扫描窗口站
yarascan # 以 Yara 签名扫描进程或内核内存
|
Linux 内存取证插件参数
 1
 2
 3
 4
 5
 6
 7
 8
 9
10
11
12
13
14
15
16
17
18
19
20
21
22
23
24
25
26
27
28
29
30
31
32
33
34
35
36
37
38
39
40
|
# 获取系统进程信息相关命令
linux_pstree # 进程树列表
linux_pslist_cache # 来自的 kmem_cache 活动进程
linux_psxview # 比较进程列表
linux_lsof # 打开文件描述符的每个活动进程
linux_pslist # 活动的进程列表
linux_psaux # 活动的进程列表(输出内容包括更多的细节)
# 获取系统内存信息的相关命令
linux_memmap # 内存映射文件
linux_pidhashtable # Linux 内核中的 PID 散列表
linux_proc_maps # 转储由-s/-vma 参数到磁盘上指定的内存范围。
linux_dump_map # 进程内存的详细信息,包括堆和共享库。
linux_bash # bash 历史文件
# 获取网络接口信息的相关命令
linux_arp # 显示 arp 列表
linux_ifconfig # 显示网络接口详细情况
linux_route_cache # 显示网络路由表
linux_netstat # 查看网络链接情况
# 获取系统硬件信息的相关命令
linux_cpuinfo # 显示 cpu 的相关命令信息。
linux_dmesg # 显示内核缓存信息。
linux_iomem # 显示 io 设备信息。
linux_mount # 显示/proc/mouns 的相关命令信息,主要是挂载的磁盘设备。
linux_mount_cache # 显示 kmem_cache 的相关命令信息。
linux_slabinfo # 显示/proc/slabinfo 的相关命令信息。
# rootkit 检测的相关命令
linux_check_afinfo # 检查篡改网络协议结构。
linux_check_creds # 检查进程共享结构。
linux_check_fop # 检查文件操作数据结构篡改情况。
linux_check_idt # 检查中断描述符表(IDT)的篡改情况。
linux_check_syscall # 在系统调用表检查功能情况。
linux_check_modules # 检查用于从内核模块列表中缺少在 sysfs 中的项目。
# 获取内核模块信息的相关命令
linux_lsmod # 加载内核模块。
linux_tmpfs # tmpfs 的内容。
|
获取镜像信息
首先获取镜像的摘要信息,一般这是进行镜像分析的第一步
1
|
volatility -f [image] imageinfo
|
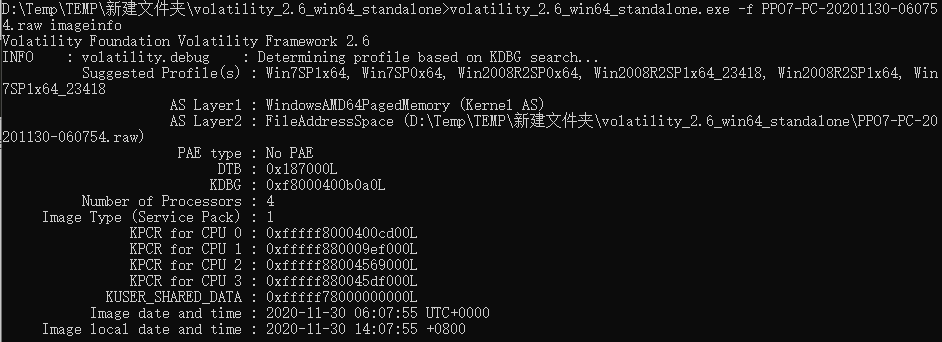
这其中比较有用的信息就是 Suggested Profile(s) ,这个是工具识别的系统版本,存在多个的原因是这是根据一些特征识别的,所以可能有误报,就把各种结果按照可能性排列出来了,一般直接选择第一个,如果加载插件报错的话,可以尝试后面的。
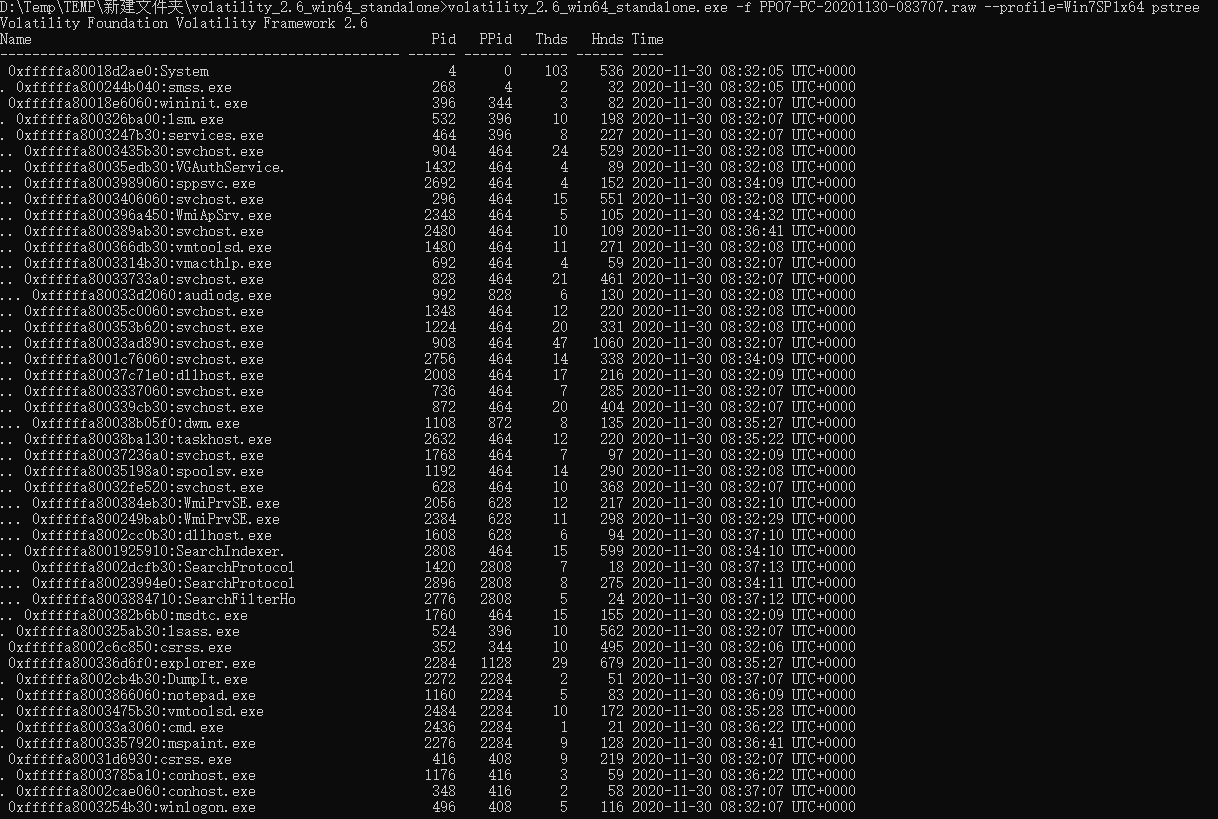
这里根据给出的结果选择第一个,然后使用 pslist 插件,看一下系统中运行的进程。
进程
按照 EPROCESS 列表列出所有正在运行的进程
1
|
volatility -f [image] --profile=[profile] pslist
|
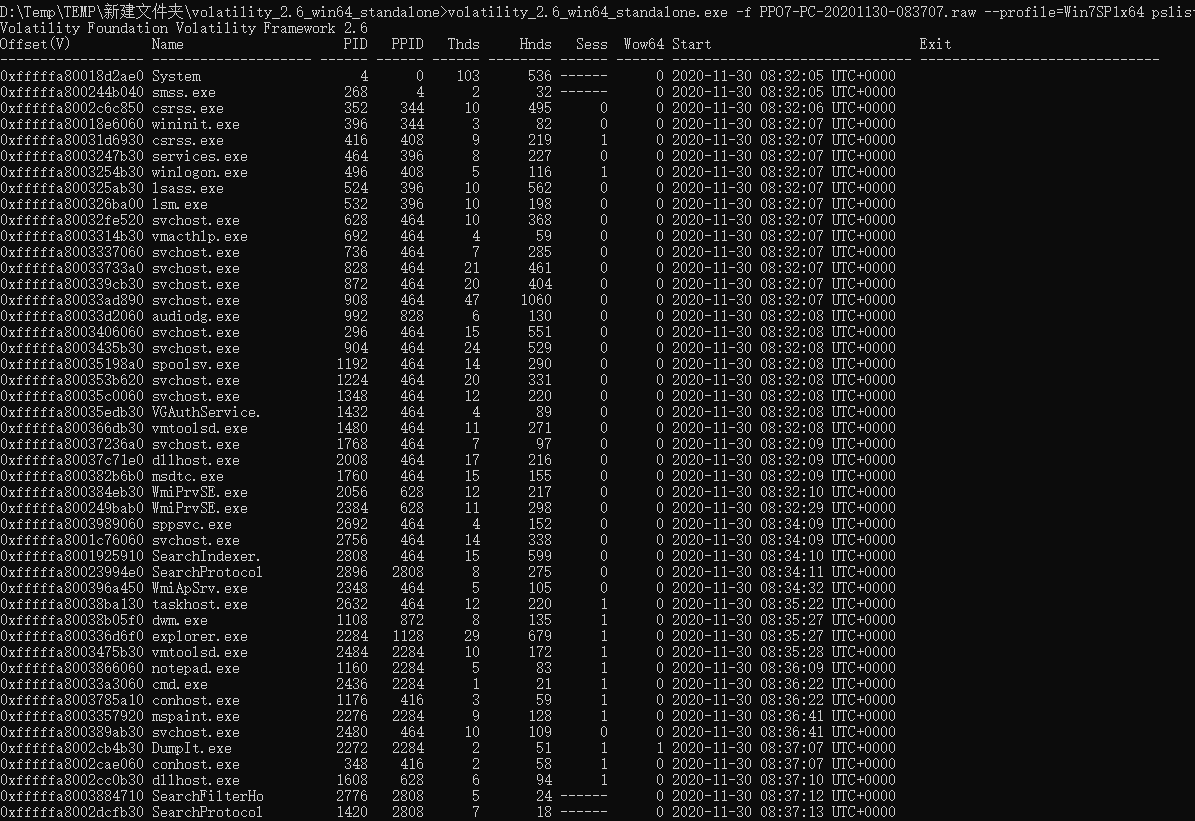
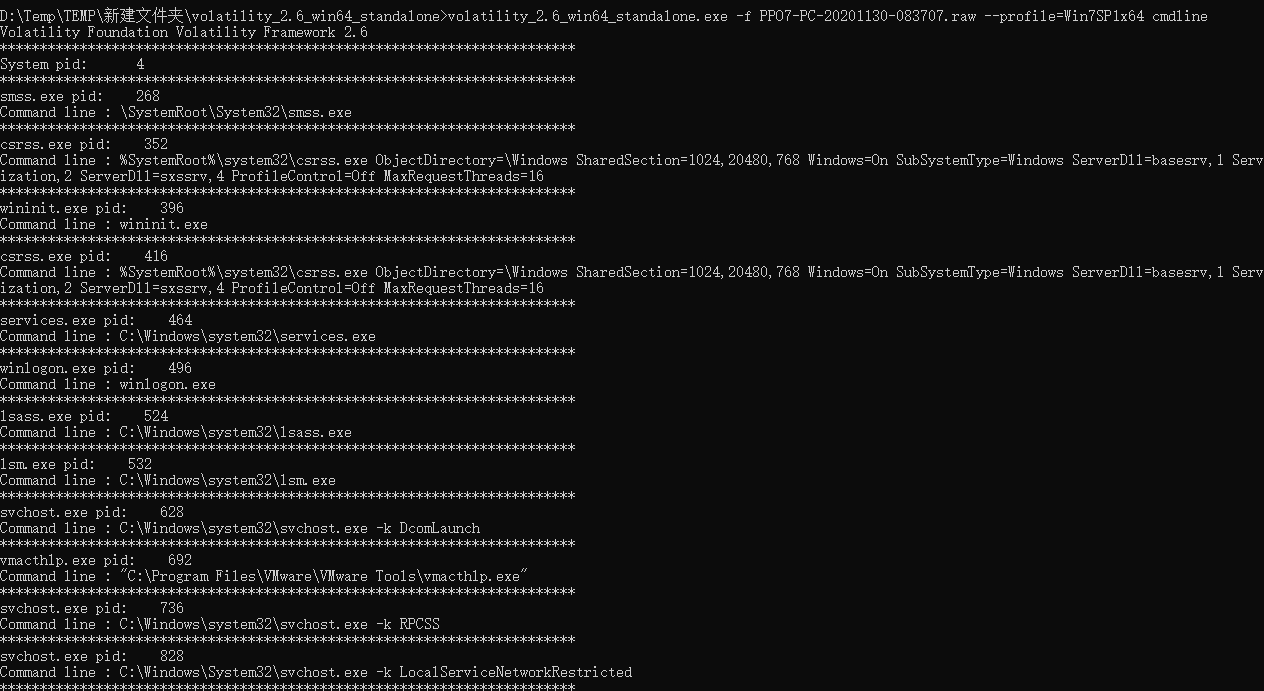
如图中 lsass.exe、winlogon.exe ,在 windows 本地登录时,用户的密码存储在 %SystemRoot%\system32\config\SAM 这个文件里。当用户输入密码进行本地认证的过程中,所有的操作都是在本地进行的。他其实就是将用户输入的密码转换为 NTLM Hash,然后与 SAM 中的 NTLM Hash 进行比较。当用户注销、重启、锁屏后,操作系统会让 winlogon 显示登录界面,也就是输入框。当 winlogon.exe 接收输入后,将密码交给 lsass 进程,这个进程中会存一份明文密码,将明文密码加密成 NTLM Hash,对 SAM 数据库比较认证。
notepad.exe 是指正在运行一个记事本程序,而 mspaint.exe 是指是微软画图程序, cmd.exe 指正在运行命令行程序
显示隐藏/终止的进程
1
|
volatility -f [image] --profile=[profile] psscan
|
以 dot 图的形式导出
1
2
3
|
python vol.py -f [image] --profile=[profile] psscan --output=dot --output-file=out.dot
apt install -y xdot
|

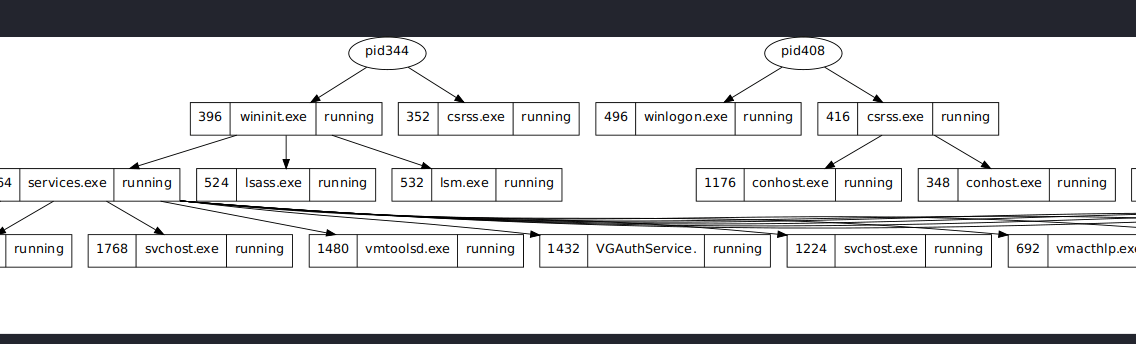
把进程以树的形式显示
1
|
volatility -f [image] --profile=[profile] pstree
|
查看 DLL 文件
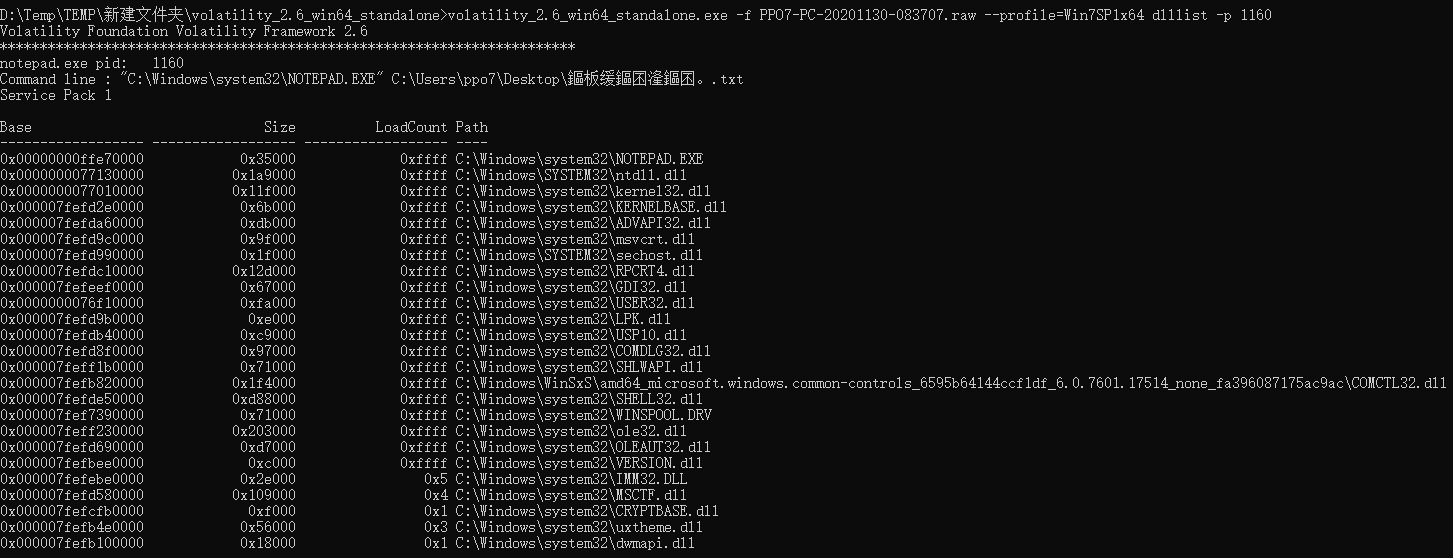
当我们发现可疑进程后,可通过此命令进行深度查看
1
|
volatility -f [image] --profile=[profile] dlllist -p [pid]
|
转储出可寻址的内存数据
在上面的进程中可以看到,存在一个 mspaint.exe 的进程,它是微软的画图软件,对于这样的情况,可以使用工具还原内存中的图片, 来当时查看的图片或者当时状态的图片,使用的工具是 gimp,可以在 linux 上安装使用。
这里首先将 mspaint.exe 的进程内存 dump 出来,使用 memdump 插件,在之前列举进程的截图中,进程名字后面一行就是该进程的 PID。
1
|
volatility -f [image] --profile=[profile] memdump -p [pid] --dump-dir ./
|

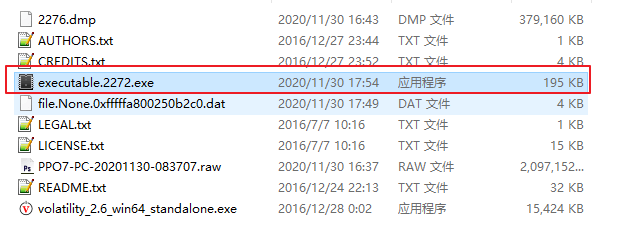
将获取到的 2276.dmp 文件改名为 2276.data,然后在 gime 中点击显示全部文件,选择 2276.data 打开
1
2
3
4
5
|
add-apt-repository ppa:otto-kesselgulasch/gimp
apt-get update
apt-get install -y gimp # 安装 gimp
gimp # 启动 gimp
mv 2276.dmp 2276.data
|
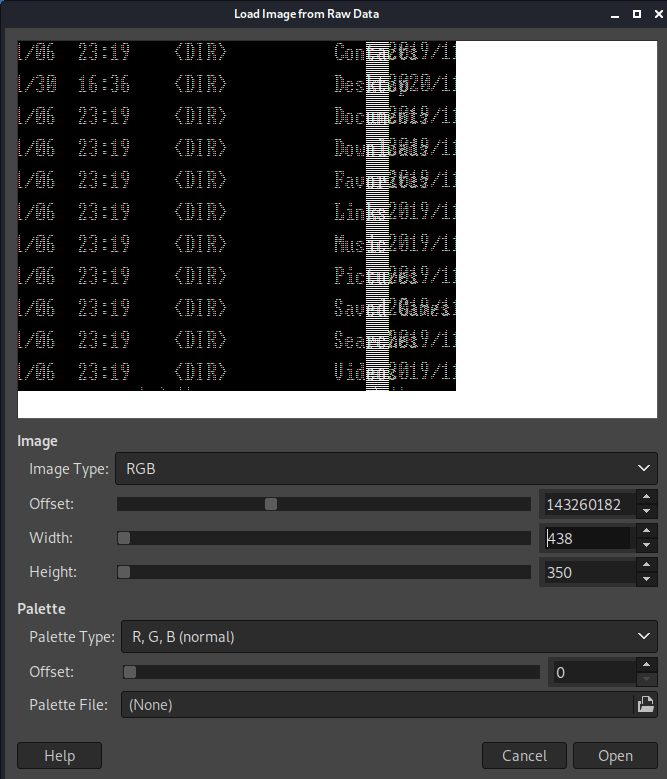
首先选择一个固定的宽度,这里选择 1000,然后调节高度把屏幕铺满,然后再大幅度拖动 Image 下的 Offset 的滑块,当看到图片类似下图时停止,可以看到隐隐约约有一张图,但是有点重叠,这时,点击上下箭头缓慢调节 Width,其中 Heigth 在调节中作用是不大的,主要是 Width 和 Offset 的调节决定是否能看到图片
微调位移为图像的左右方向平移,大幅调节位移则是图像的上下方向平移。而宽度不变时,始终显示的都是同一幅图像。
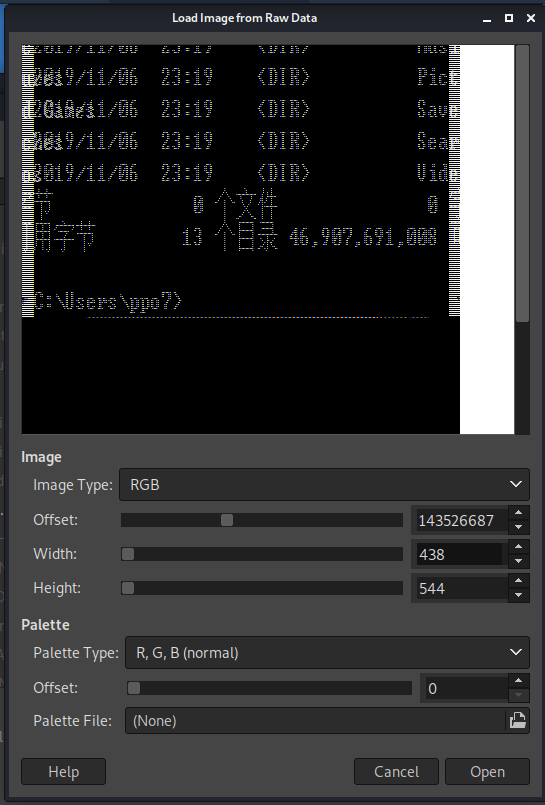
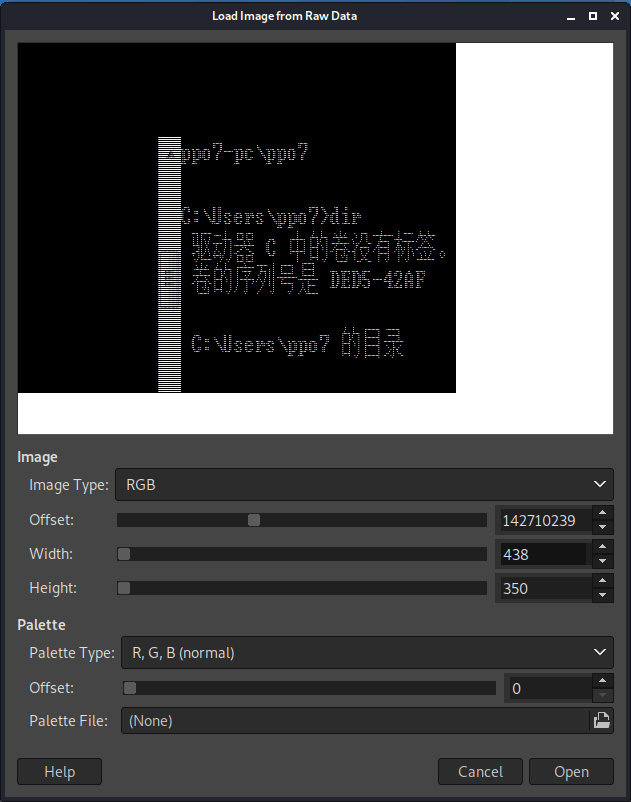
在调节时,不仅仅只能看到画图程序的图片,如下图,就调出了另一个状态的一个系统图片
获取运行过的命令
在上面查看进程时,可以看到存在一个 cmd 进程,那么可以使用 cmdscan 插件来查看运行过的命令,
1
|
volatility -f [image] --profile=[profile] cmdscan
|
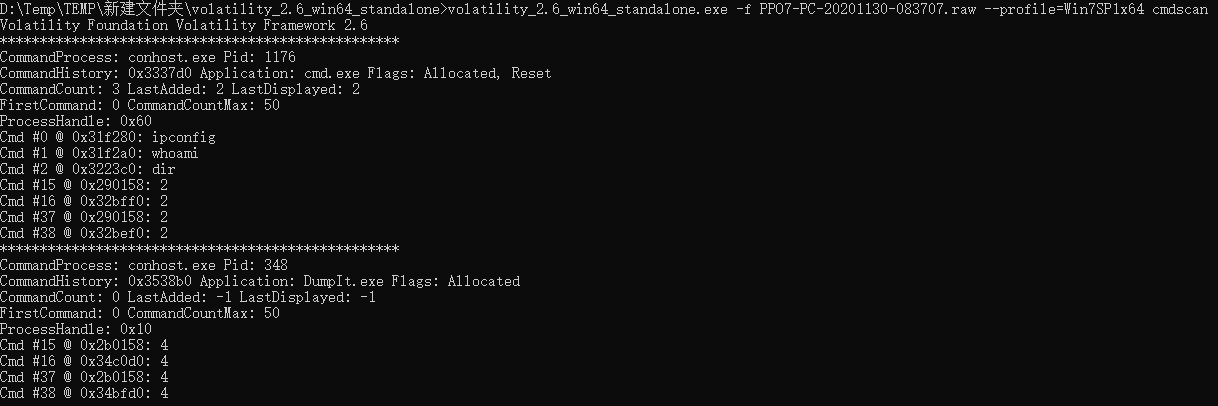
可以看到执行了 whoami、ifconfig、ipconfig 这三个命令
查看进程命令行参数
1
|
volatility -f [image] --profile=[profile] cmdline
|
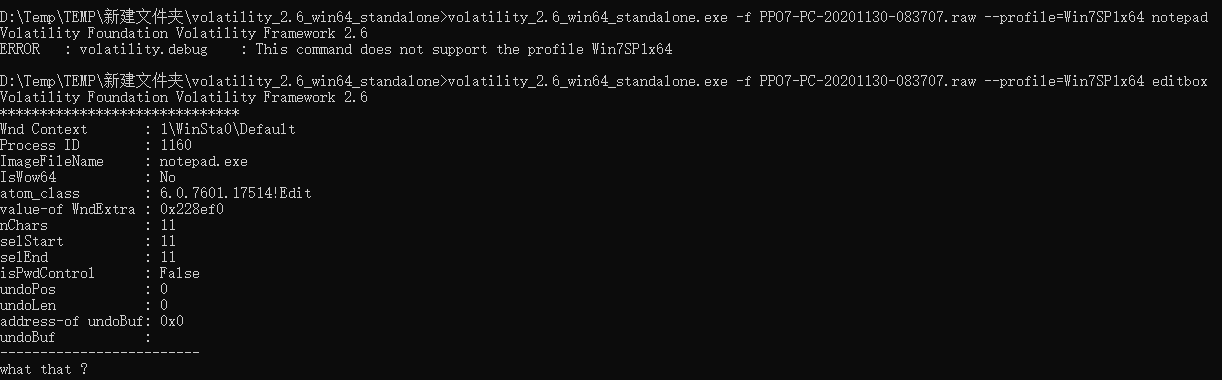
信息
获取记事本数据
1
2
3
4
5
|
volatility -f [image] --profile=[profile] notepad
# 当上面这个插件不支持这个系统,这时可以使用 editbox 查看
volatility -f [image] --profile=[profile] editbox
|
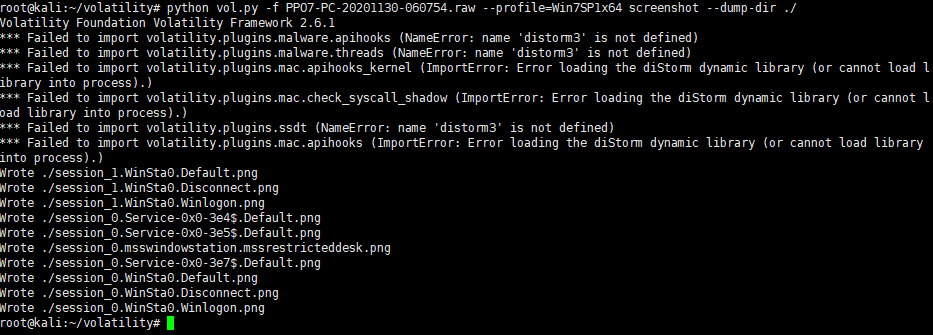
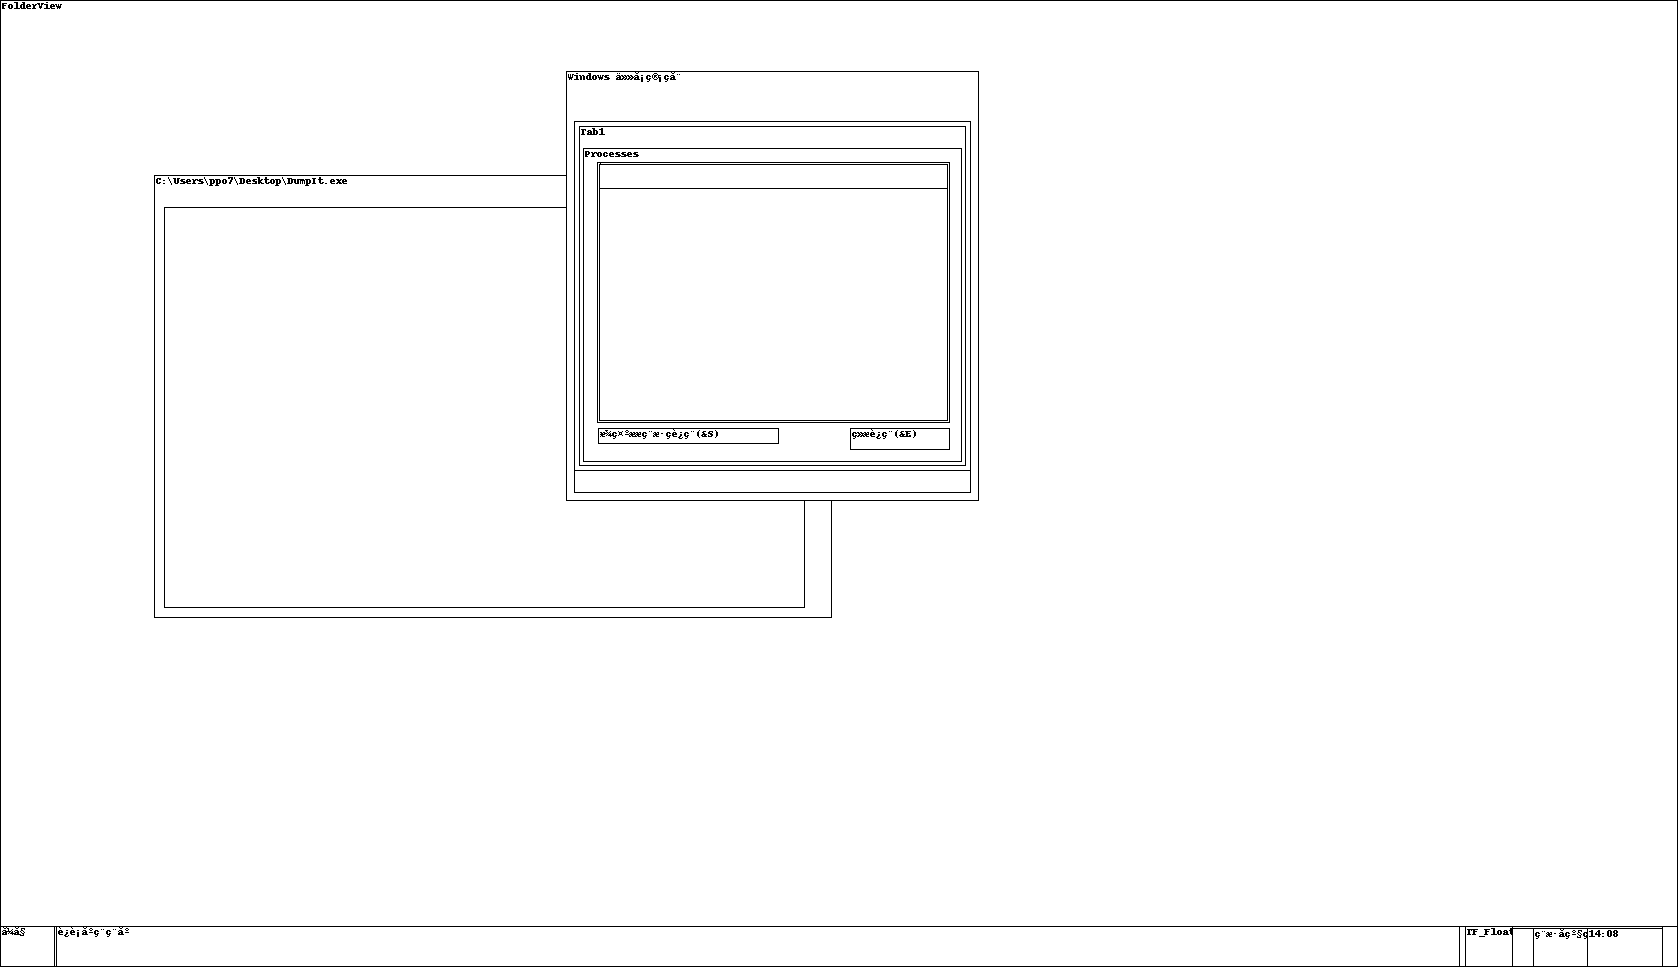
查看当前桌面截图
可以使用 screenshot 查看查看当前桌面的伪截图,其中会显示桌面上窗口的框,不会显示其中的内容
1
|
volatility -f [image] --profile=[profile] screenshot --dump-dir ./
|
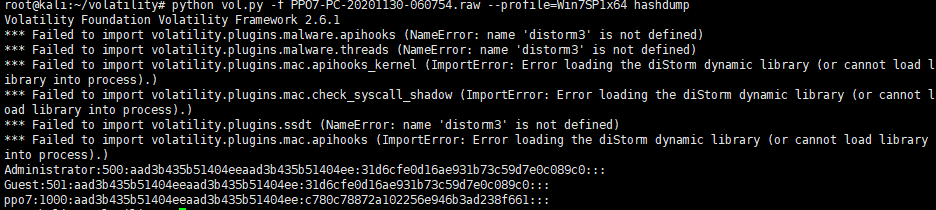
获取系统中的用户以及密码
1
|
volatility -f [image] --profile=[profile] hashdump
|
查看剪切版中的信息
1
|
volatility -f [image] --profile=[profile] clipboard
|
扫一下 ie 浏览记录
1
|
volatility -f [image] --profile=[profile] yarascan
|
文件
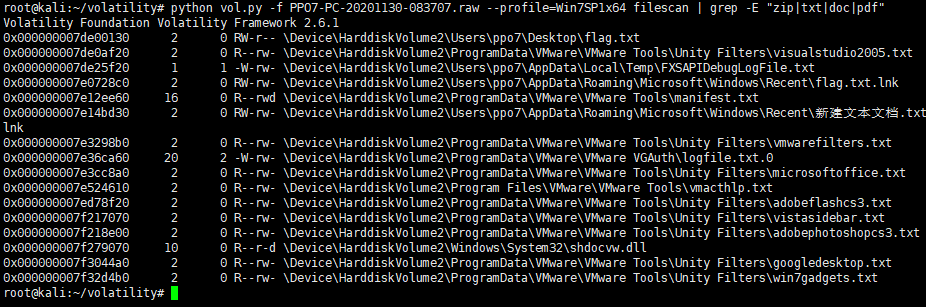
查看系统中的文件
通过 filescan 命令,可以扫描当前状态下的一些文件,例如桌面的文件,或者特定类型的文件,这些都是结合 grep 命令来实现的
1
|
volatility -f [image] --profile=[profile] filescan | grep -E "zip|txt|doc|pdf"
|
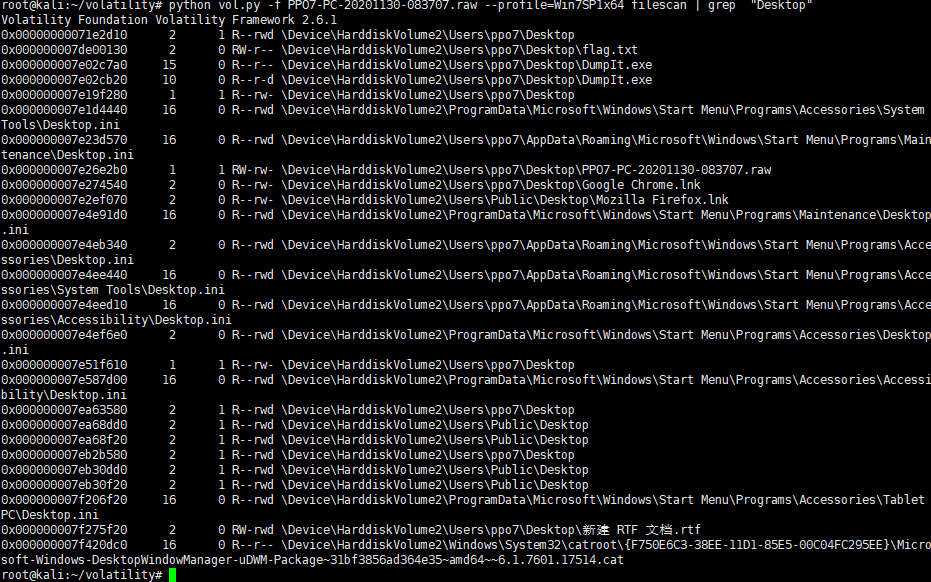
查看桌面的文件
1
|
volatility -f [image] --profile=[profile] filescan | grep "Desktop"
|
dump 扫描到的文件
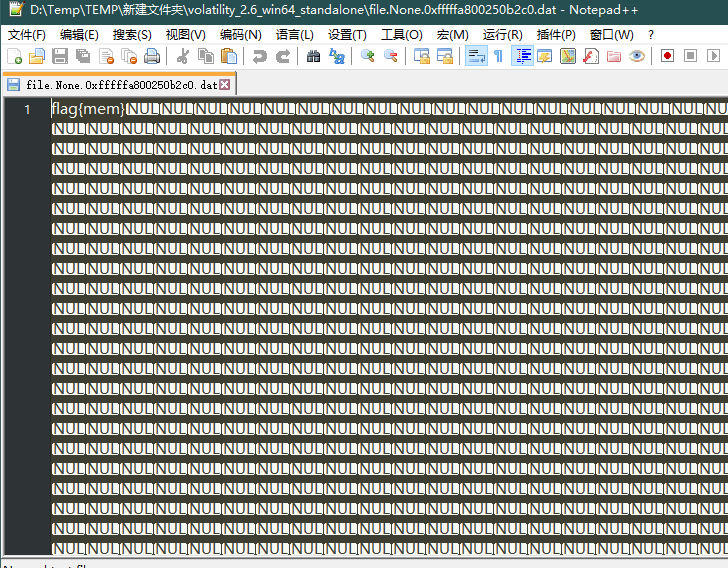
在上一步中,发现了桌面的一个 flag.txt,那么可以使用 dumpfiles 命令来将文件 dump 出来
1
2
3
|
volatility -f [image] --profile=[profile] dumpfiles -Q 0x000000007de00130 --dump-dir ./
# 这里的 -Q 参数是前面扫描时候的第一个参数,标记了文件的转储的物理地址
|

dump 出的文件默认是 dat 后缀的,可以使用 linux 下的 file 命令来查看获取的文件类型,或者是根据之前扫描文件获取到的文件名来修改后缀
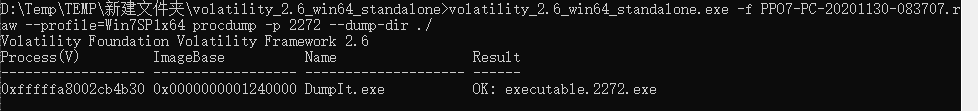
转储内存中的进程里 exe 文件
1
|
volatility -f [image] --profile=[profile] procdump -p [pid] --dump-dir ./
|
网络
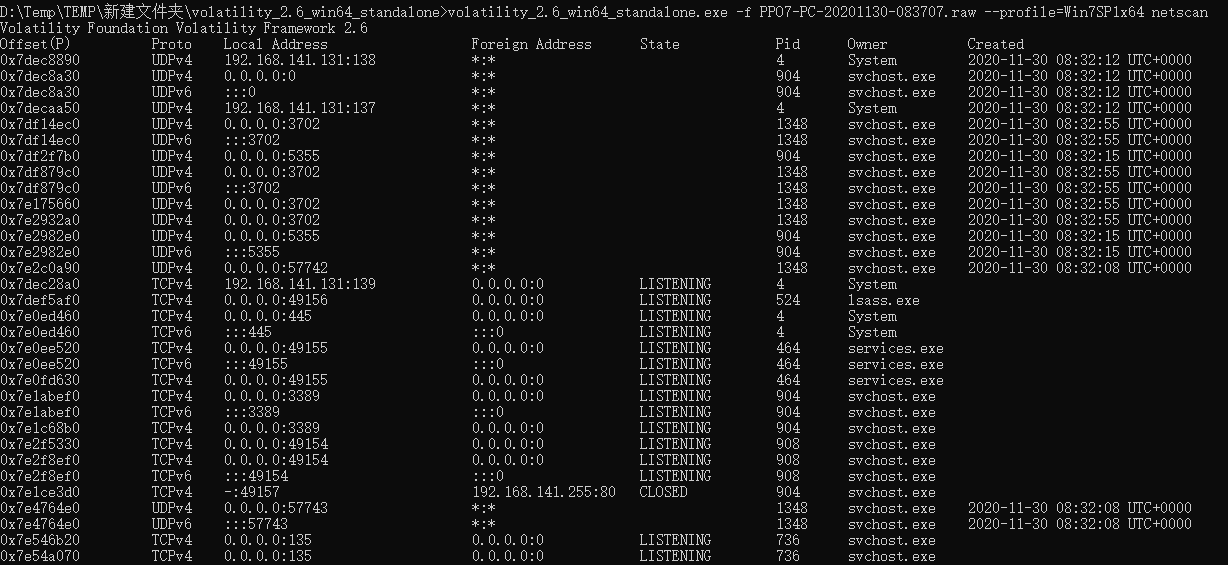
查看系统开放端口以及连接情况
1
|
volatility -f [image] --profile=[profile] netscan
|
注册表信息
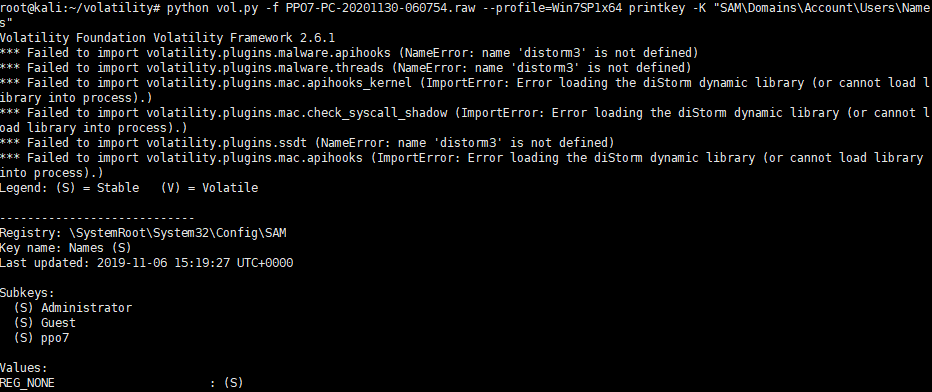
打印注册表项及其子项和对应的值
1
|
volatility -f [image] --profile=[profile] printkey -K "SAM\Domains\Account\Users\Names"
|
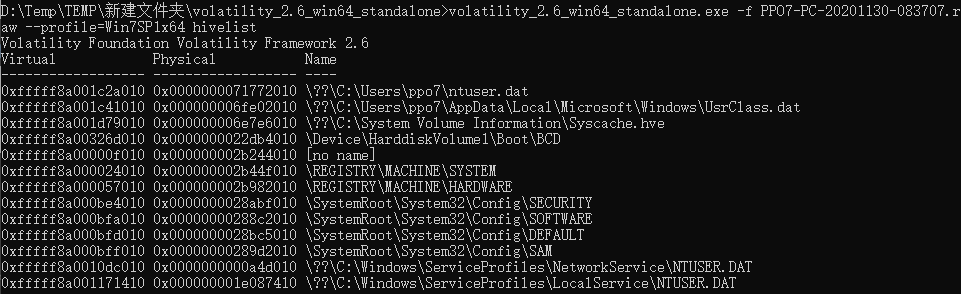
列出注册表配置文件中的注册表信息
1
|
volatility -f [image] --profile=[profile] hivelist
|
打印内存中指定的注册表信息
1
2
|
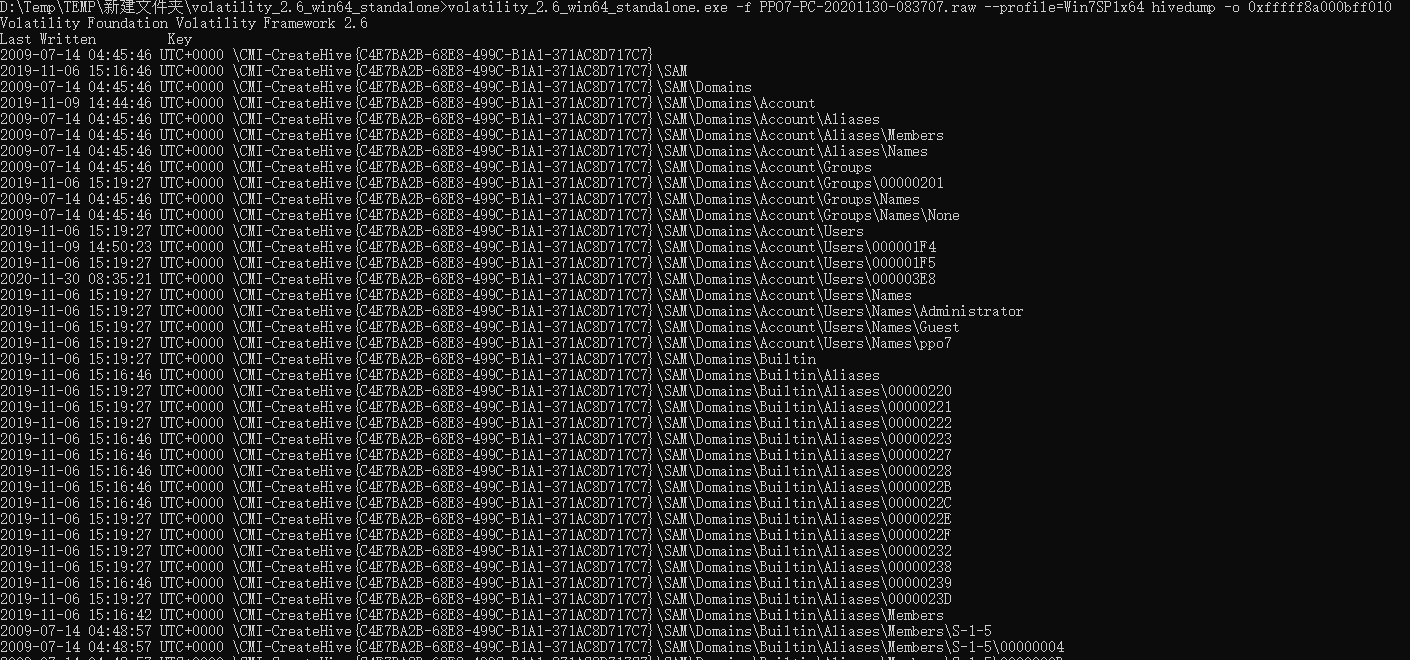
volatility -f [image] --profile=[profile] hivedump -o 0xfffff8a000bff010
# -o 跟虚拟地址
|
Linux Profile
使用第三方 Profile
在 https://github.com/KDPryor/LinuxVolProfiles 处直接下载已经做好的 profile 文件(zip 文件)然后复制到目录后解压缩即可。
1
2
3
4
5
|
git clone https://github.com/KDPryor/LinuxVolProfiles.git
cd LinuxVolProfiles
mv Ubuntu-3.8.0-19.zip /volatility/volatility/plugins/overlays/linux/
cd /volatility/volatility/plugins/overlays/linux
unzip Ubuntu-3.8.0-19.zip
|
制作 Profile
Volatility 自带一些 windows 系统的 profile,Linux 系统的 Profile 需要自己制作,制作的方法如下:实际是将 module.dwarf 和 system.map 打包成一个 zip 文件,接着将 zip 文件移动到 volatility/plugins/overlays/linux/ 目录中。
这里以 centos7 为例,先安装 dwarfdump(必须安装,创建 module.dwarf 文件的依赖)
1
2
3
4
5
6
7
8
9
10
|
yum install -y gcc make gcc-c++
yum install -y elfutils-devel
yum install -y kernel-devel
wget https://www.prevanders.net/libdwarf-20201201.tar.gz
tar -zxvf libdwarf-20201201.tar.gz
cd libdwarf-20201201
./configure
make
make install
cd ../
|
在 volatility 目录中的 tool/Linux 运行 make 命令来创建 module.dwarf 文件
1
2
3
4
5
|
git clone https://github.com/volatilityfoundation/volatility.git
cd volatility/tools/linux
make
ls -l
|
打包,将 centos7.zip 移至分析机的 volatility/plugins/overlays/linux/ 目录中
1
|
zip centos7.zip /boot/System.map* module.dwarf
|
在分析机上将 centos7.zip 至 volatility/plugins/overlays/linux/ 目录中
1
2
|
mv centos7.zip /pentest/volatility/plugins/overlays/linux/
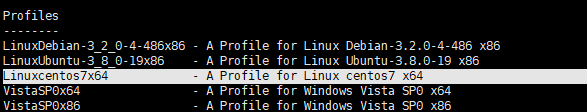
python vol.py --info | grep "centos7"
|
实战 linux 分析
住:这里 LiME 导出的无法成功解析,不知道原因
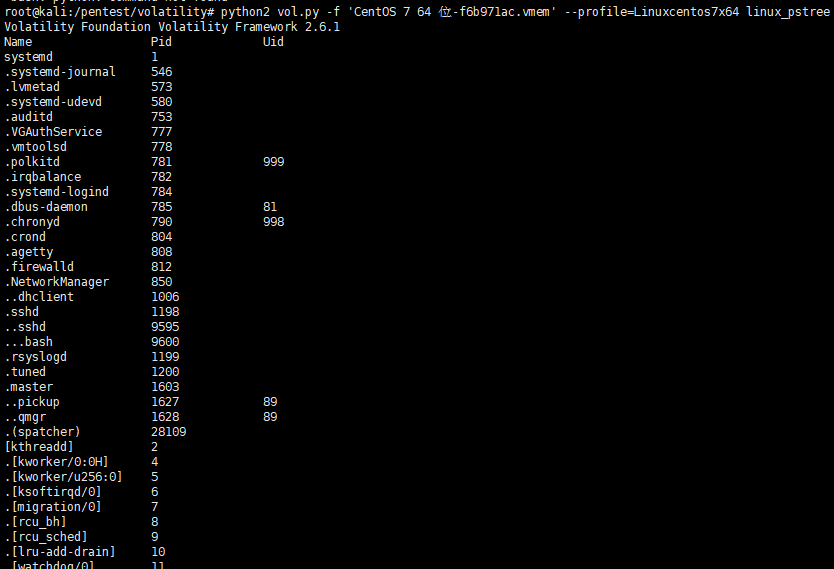
直接复制 centos7 的内存文件,放到分析机上,查看进程树列表
1
|
python vol.py -f tmp.vmem --profile=Linuxcentos7x64 linux_pstree
|
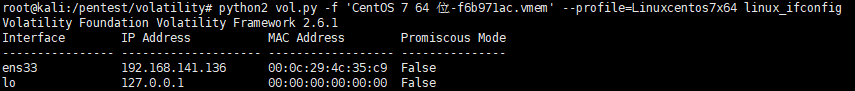
显示网络接口详细情况
1
|
python vol.py -f tmp.vmem --profile=Linuxcentos7x64 linux_pstree
|
查看某具体进程的情况
1
|
python vol.py -f tmp.vmem --profile=Linuxcentos7x64 linux_proc_maps
|
volatility3
Volatility3 是对 Volatility2 的重写,它基于 Python3 编写,对 Windows 10 的内存取证很友好,且速度比 Volatility2 快很多。对于用户而言,新功能的重点包括:大幅提升性能,消除了对 –profile 的依赖,以便框架确定需要哪个符号表(配置文件)来匹配内存示例中的操作系统版本,在 64 位系统(例如 Window 的 wow64)上正确评估 32 位代码,自动评估内存中的代码,以避免对分析人员进行尽可能多的手动逆向工程。对于开发人员:更加轻松地集成到用户的第三方接口和库中,广泛的 API 文档,插件可以直接调用其他插件的能力,插件版本控,直接集成自定义符号表和数据结构。
安装
1
2
3
4
5
|
git clone https://github.com/volatilityfoundation/volatility3.git
cd volatility3
python3 setup.py build
python3 setup.py install
python3 vol.py -h
|
符号表集
1
2
3
4
5
6
7
8
|
cd /tmp
wget downloads.volatilityfoundation.org/volatility3/symbols/windows.zip
wget downloads.volatilityfoundation.org/volatility3/symbols/mac.zip
wget downloads.volatilityfoundation.org/volatility3/symbols/linux.zip
mkdir -p /pentest/volatility3/symbols
mv /tmp/windows.zip /pentest/volatility3/symbols
mv /tmp/mac.zip /pentest/volatility3/symbols
mv /tmp/linux.zip /pentest/volatility3/symbols
|
常用插件
 1
 2
 3
 4
 5
 6
 7
 8
 9
10
11
12
13
14
15
16
17
18
19
20
21
22
23
24
25
26
27
28
29
30
31
32
33
34
35
36
37
38
39
40
41
42
43
44
45
46
47
48
49
50
51
52
53
54
55
56
57
58
59
60
61
62
63
64
65
66
67
68
69
70
71
72
73
74
75
76
77
78
79
80
81
82
83
84
85
86
|
banners.Banners Attempts to identify potential linux banners in an image
configwriter.ConfigWriter Runs the automagics and both prints and outputs configuration in the output directory.
frameworkinfo.FrameworkInfo Plugin to list the various modular components of Volatility
isfinfo.IsfInfo Determines information about the currently available ISF files, or a specific one
layerwriter.LayerWriter Runs the automagics and writes out the primary layer produced by the stacker.
linux.bash.Bash Recovers bash command history from memory.
linux.check_afinfo.Check_afinfo Verifies the operation function pointers of network protocols.
linux.check_creds.Check_creds Checks if any processes are sharing credential structures
linux.check_idt.Check_idt Checks if the IDT has been altered
linux.check_modules.Check_modules Compares module list to sysfs info, if available
linux.check_syscall.Check_syscall Check system call table for hooks.
linux.elfs.Elfs Lists all memory mapped ELF files for all processes.
linux.keyboard_notifiers.Keyboard_notifiers Parses the keyboard notifier call chain
linux.lsmod.Lsmod Lists loaded kernel modules.
linux.lsof.Lsof Lists all memory maps for all processes.
linux.malfind.Malfind Lists process memory ranges that potentially contain injected code.
linux.proc.Maps Lists all memory maps for all processes.
linux.pslist.PsList Lists the processes present in a particular linux memory image.
linux.pstree.PsTree Plugin for listing processes in a tree based on their parent process ID.
linux.tty_check.tty_check Checks tty devices for hooks
mac.bash.Bash Recovers bash command history from memory.
mac.check_syscall.Check_syscall Check system call table for hooks.
mac.check_sysctl.Check_sysctl Check sysctl handlers for hooks.
mac.check_trap_table.Check_trap_table Check mach trap table for hooks.
mac.ifconfig.Ifconfig Lists loaded kernel modules
mac.kauth_listeners.Kauth_listeners Lists kauth listeners and their status
mac.kauth_scopes.Kauth_scopes Lists kauth scopes and their status
mac.kevents.Kevents Lists event handlers registered by processes
mac.list_files.List_Files Lists all open file descriptors for all processes.
mac.lsmod.Lsmod Lists loaded kernel modules.
mac.lsof.Lsof Lists all open file descriptors for all processes.
mac.malfind.Malfind Lists process memory ranges that potentially contain injected code.
mac.mount.Mount A module containing a collection of plugins that produce data typically foundin Mac's mount command
mac.netstat.Netstat Lists all network connections for all processes.
mac.proc_maps.Maps Lists process memory ranges that potentially contain injected code.
mac.psaux.Psaux Recovers program command line arguments.
mac.pslist.PsList Lists the processes present in a particular mac memory image.
mac.pstree.PsTree Plugin for listing processes in a tree based on their parent process ID.
mac.socket_filters.Socket_filters Enumerates kernel socket filters.
mac.timers.Timers Check for malicious kernel timers.
mac.trustedbsd.Trustedbsd Checks for malicious trustedbsd modules
mac.vfsevents.VFSevents Lists processes that are filtering file system events
timeliner.Timeliner Runs all relevant plugins that provide time related information and orders the results by time.
windows.bigpools.BigPools List big page pools.
windows.cachedump.Cachedump Dumps lsa secrets from memory
windows.callbacks.Callbacks Lists kernel callbacks and notification routines.
windows.cmdline.CmdLine Lists process command line arguments.
windows.dlllist.DllList Lists the loaded modules in a particular windows memory image.
windows.driverirp.DriverIrp List IRPs for drivers in a particular windows memory image.
windows.driverscan.DriverScan Scans for drivers present in a particular windows memory image.
windows.dumpfiles.DumpFiles Dumps cached file contents from Windows memory samples.
windows.envars.Envars Display process environment variables
windows.filescan.FileScan Scans for file objects present in a particular windows memory image.
windows.getservicesids.GetServiceSIDs Lists process token sids.
windows.getsids.GetSIDs Print the SIDs owning each process
windows.handles.Handles Lists process open handles.
windows.hashdump.Hashdump Dumps user hashes from memory
windows.info.Info Show OS & kernel details of the memory sample being analyzed.
windows.lsadump.Lsadump Dumps lsa secrets from memory
windows.malfind.Malfind Lists process memory ranges that potentially contain injected code.
windows.memmap.Memmap Prints the memory map
windows.modscan.ModScan Scans for modules present in a particular windows memory image.
windows.modules.Modules Lists the loaded kernel modules.
windows.mutantscan.MutantScan Scans for mutexes present in a particular windows memory image.
windows.netscan.NetScan Scans for network objects present in a particular windows memory image.
windows.netstat.NetStat Traverses network tracking structures present in a particular windows memory image.
windows.poolscanner.PoolScanner A generic pool scanner plugin.
windows.privileges.Privs Lists process token privileges
windows.pslist.PsList Lists the processes present in a particular windows memory image.
windows.psscan.PsScan Scans for processes present in a particular windows memory image.
windows.pstree.PsTree Plugin for listing processes in a tree based on their parent process ID.
windows.registry.certificates.Certificates Lists the certificates in the registry's Certificate Store.
windows.registry.hivelist.HiveList Lists the registry hives present in a particular memory image.
windows.registry.hivescan.HiveScan Scans for registry hives present in a particular windows memory image.
windows.registry.printkey.PrintKey Lists the registry keys under a hive or specific key value.
windows.registry.userassist.UserAssist Print userassist registry keys and information.
windows.ssdt.SSDT Lists the system call table.
windows.statistics.Statistics
windows.strings.Strings Reads output from the strings command and indicates which process(es) each string belongs to.
windows.svcscan.SvcScan Scans for windows services.
windows.symlinkscan.SymlinkScan Scans for links present in a particular windows memory image.
windows.vadinfo.VadInfo Lists process memory ranges.
windows.vadyarascan.VadYaraScan Scans all the Virtual Address Descriptor memory maps using yara.
windows.verinfo.VerInfo Lists version information from PE files.
windows.virtmap.VirtMap Lists virtual mapped sections.
yarascan.YaraScan Scans kernel memory using yara rules (string or file).
|
使用
volatility3 运行时需要下载 PDB 符号表,国内机器需要挂代理
信息
layerwriter
1
|
python3 vol.py -f [image] layerwriter
|
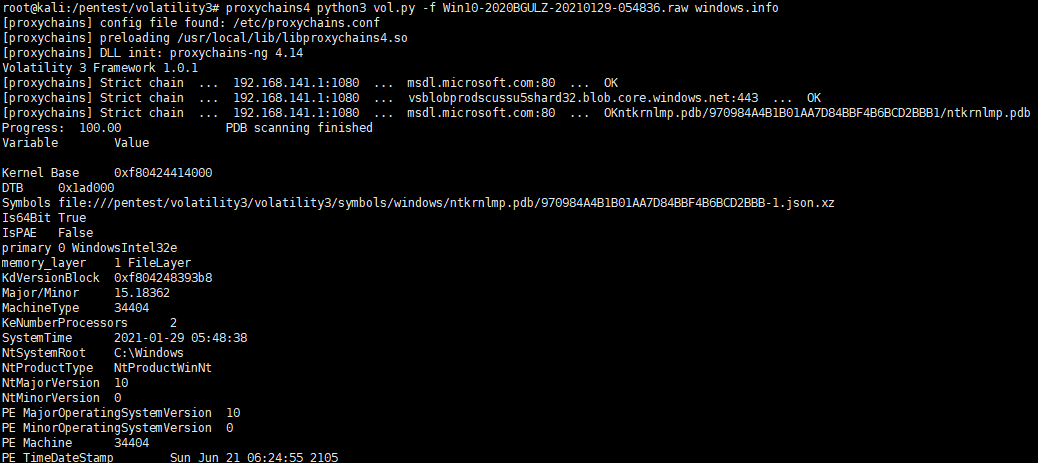
windows.info
1
|
python3 vol.py -f [image] windows.info
|
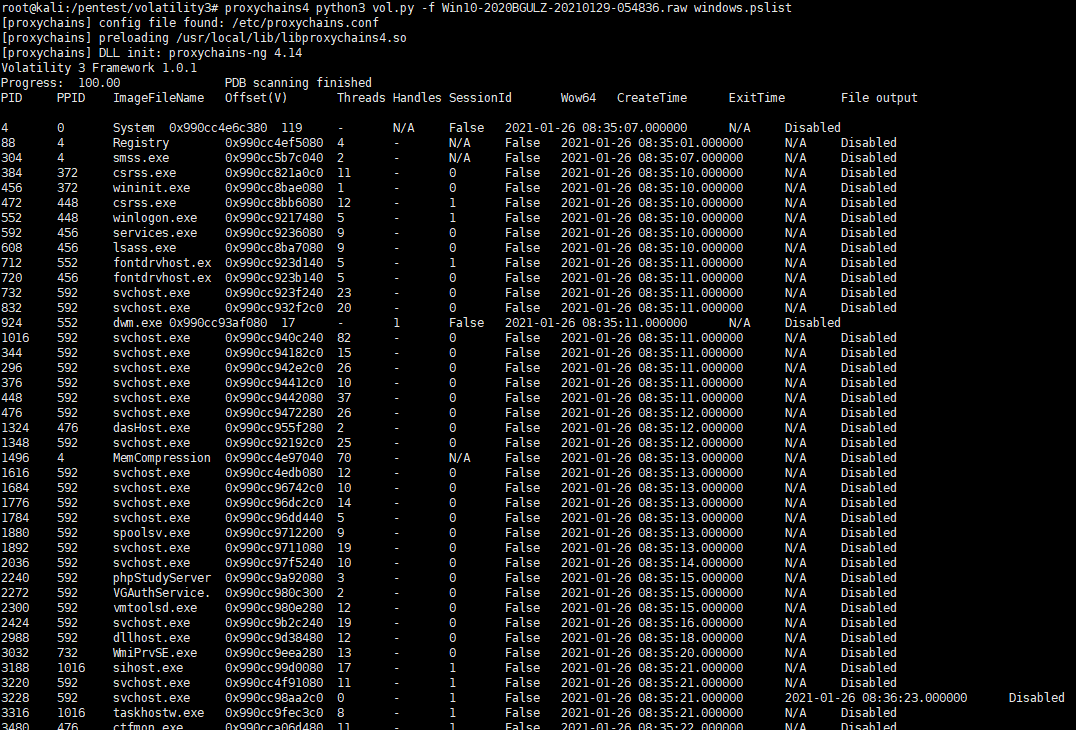
windows.pslist
1
|
python3 vol.py -f [image] windows.pslist
|
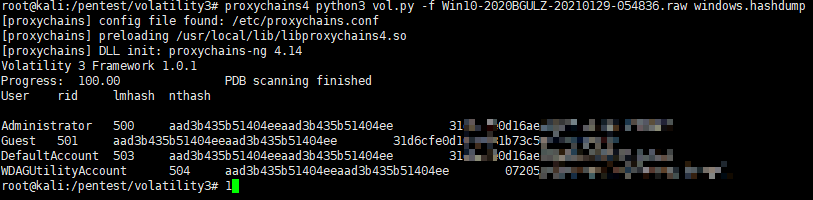
windows.hashdump
1
|
python3 vol.py -f [image] windows.hashdump
|
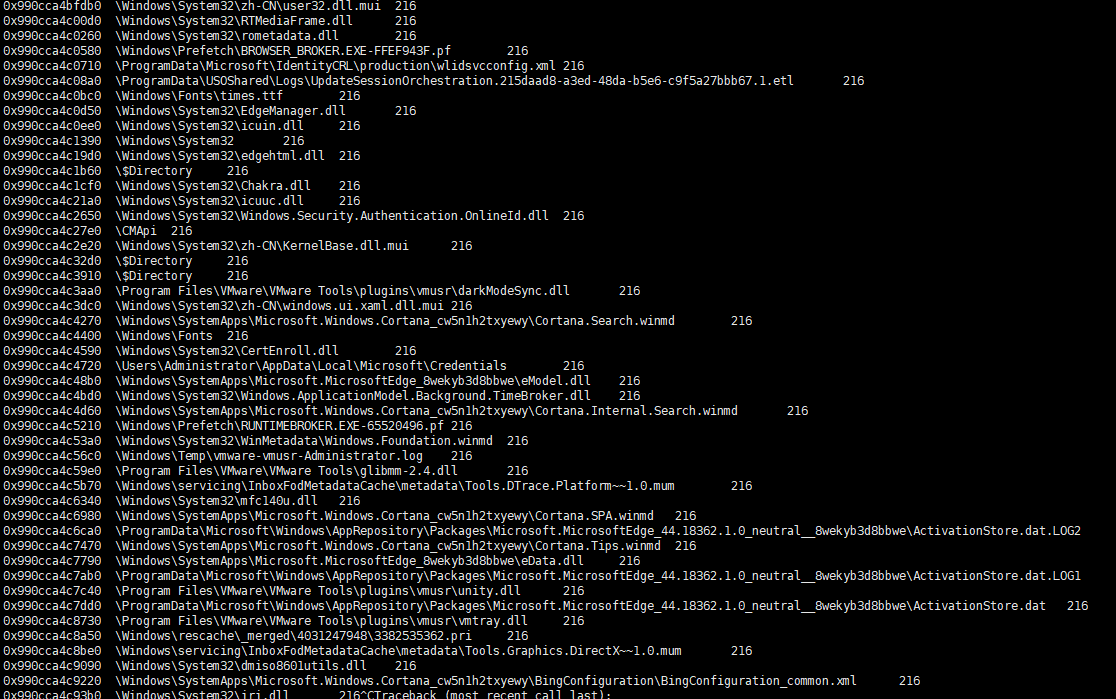
windows.filescan
1
|
python3 vol.py -f [image] windows.filescan
|
Symbol Tables
所有文件都以 JSON 数据的形式存储,它们可以是. json 的纯 JSON 文件,也可以是. json.gz 或. json.xz 的压缩文件。Volatility 会在使用时自动解压它们。使用时也会将它们的内容(压缩后)缓存起来,位于用户主目录下的. cache/volatility3 中,以及其他有用的数据。缓存目录目前无法更改。
符号表 JSON 文件默认位于 volatility/symbols 下,在操作系统目录下(目前是 windows、mac 或 linux 中的一种)。符号目录是可以在框架内配置的,通常可以在用户界面上设置。
这些文件也可以被压缩成 ZIP 文件,Volatility 将处理 ZIP 文件以定位符号文件。ZIP 文件必须以相应的操作系统命名(如 linux.zip、mac.zip 或 windows.zip)。在 ZIP 文件中,目录结构应与未压缩的操作系统目录一致。
-
Windows 符号表
对于 Windows 系统,Volatility 接受由 GUID 和所需 PDB 文件的 Age 组成的字符串。然后,它在 Windows 子目录下的已配置符号目录下搜索所有文件。与文件名模式 /-.json(或任何压缩变体)匹配的任何文件都会被使用。如果找不到这样的符号表,则将从 Microsoft 的 Symbol Server 下载关联的 PDB 文件,并将其转换为适当的 JSON 格式,并将其保存在正确的位置。
Windows 符号表可以从适当的 PDB 文件手动构建。用于执行此操作的主要工具内置于 Volatility 3 中,称为 pdbconv.py。
-
Mac / Linux 符号表
对于 Mac / Linux 系统,两者都使用相同的识别机制。JSON 文件位于符号目录下的 linux 或 mac 目录下。生成的文件包含一个标识字符串(操作系统横幅),Volatility 的 automagic 可以检测到该字符串。易失性会缓存字符串和它们来自的符号表之间的映射,这意味着精确的文件名无关紧要,并且可以在操作系统目录下的任何必要层次结构下进行组织。
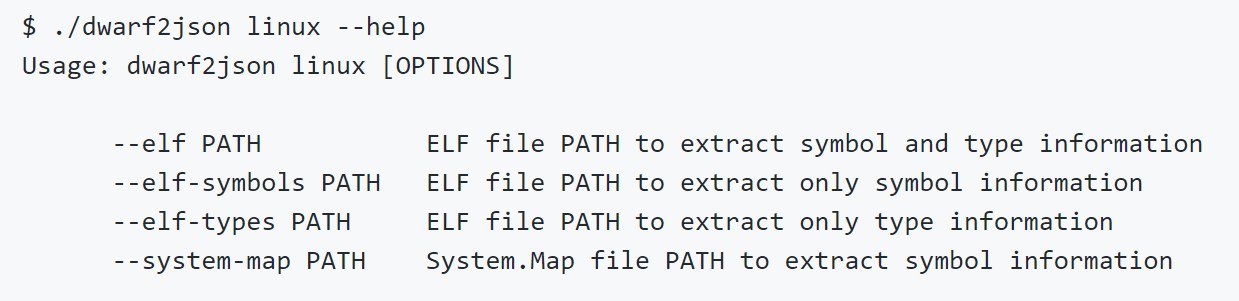
可以使用称为 dwarf2json 的工具从 DWARF 文件生成 Linux 和 Mac 符号表。当前,带有调试符号的内核是恢复大多数 Volatility 插件所需的所有信息的唯一合适方法。找到具有调试符号 / 适当的 DWARF 文件的内核之后,dwarf2json 会将其转换为适当的 JSON 文件。
相关工具
MacOS Processing
1
2
|
./dwarf2json mac --macho /path/kernel.dSYM/Contents/Resources/DWARF/kernel \
--macho-symbols /path/kernel > output.json
|
Linux Processing
1
|
./dwarf2json linux --elf /usr/lib/debug/boot/vmlinux-4.4.0-137-generic > output.json
|
以 ubuntu18.04 为例
1
2
3
4
|
chmod +x dwarf2json
./dwarf2json linux --elf /usr/lib/debug/boot/vmlinux-5.0.0-23-generic > Ubuntu1804.json
# 这里有个小坑,内存尽量大于8G,不然会报错
|
1
2
3
4
5
|
mv Ubuntu1804.json /pentest/volatility3/volatility3/framework/symbols/linux
cd /pentest/volatility3
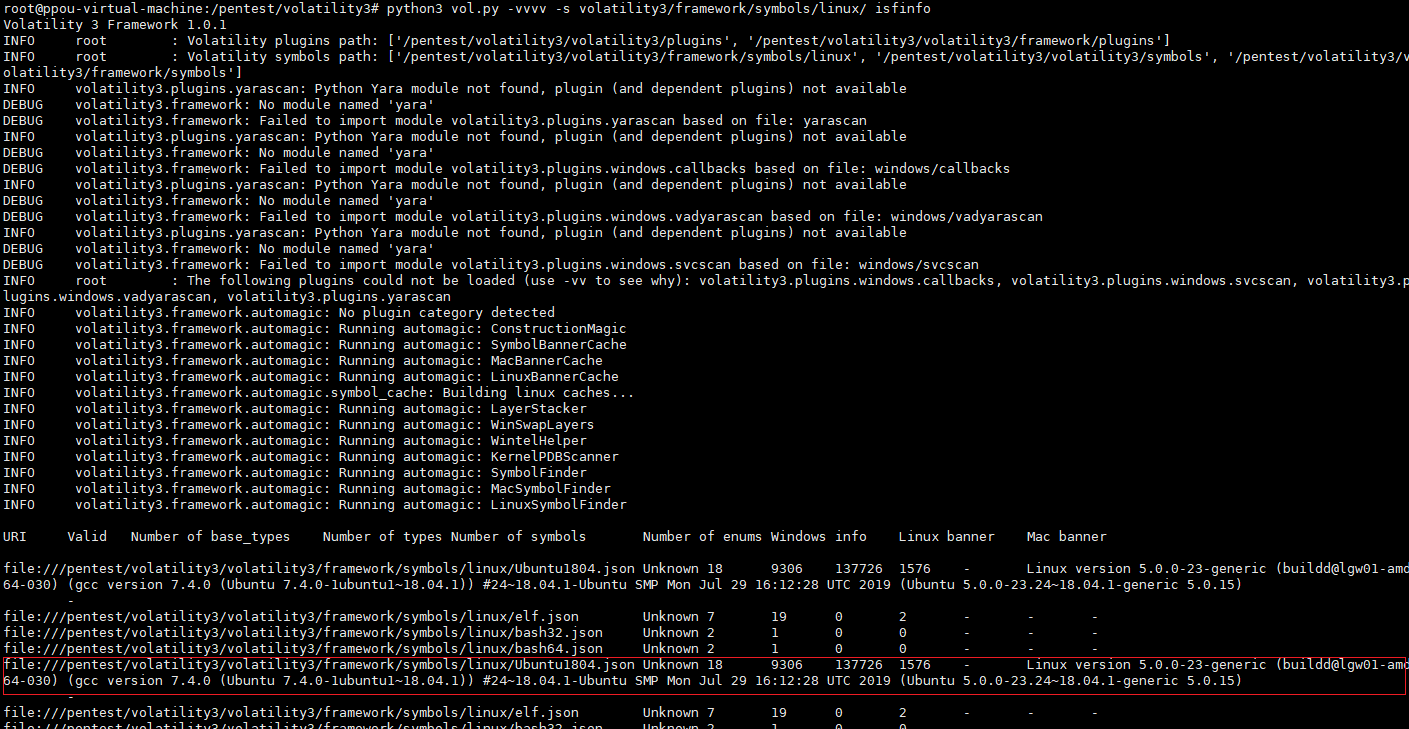
python3 vol.py -vvvv isfinfo
python3 vol.py -vvvv -s volatility3/framework/symbols/linux/ isfinfo
python3 vol.py isfinfo --isf /pentest/volatility3/volatility3/framework/symbols/linux/Ubuntu1804.json
|
1
|
python3 vol.py -vvvv -f cyq.vmem banners
|
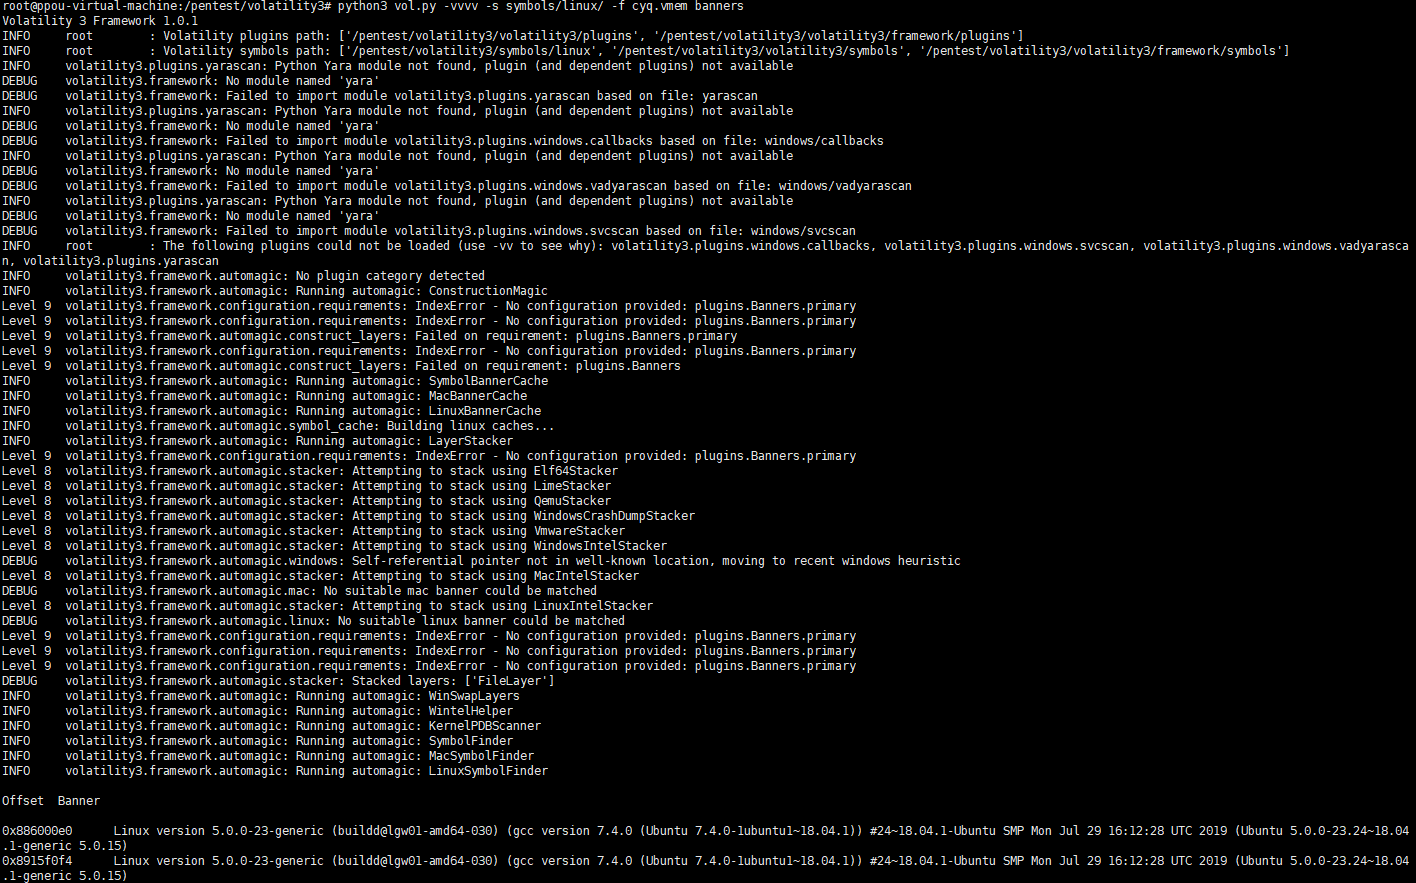
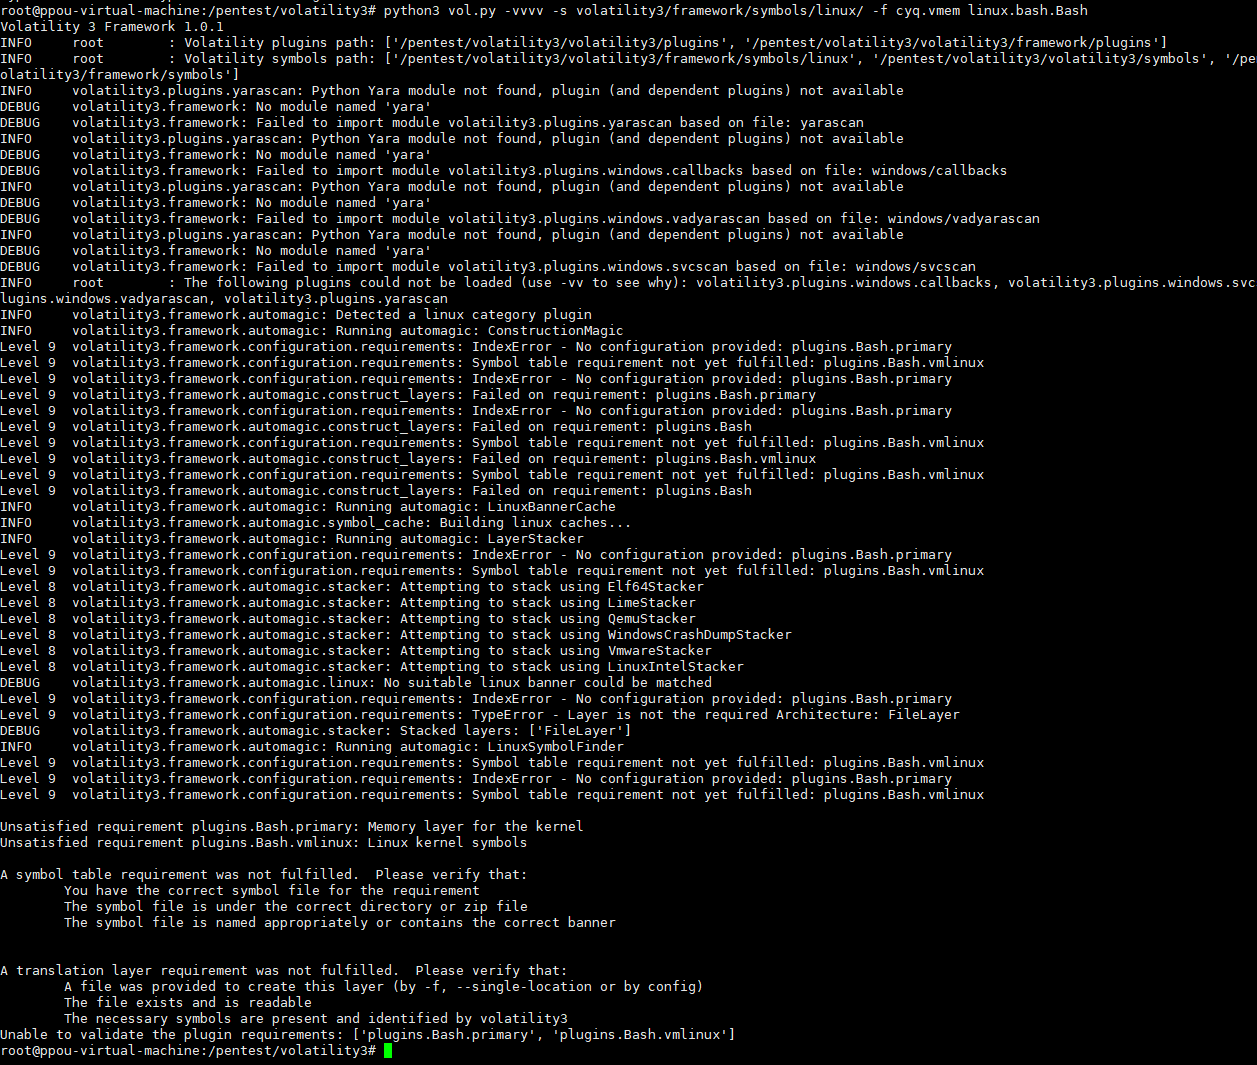
即使输出与 banner 匹配, 实际运行依旧失败, 此 issues https://github.com/volatilityfoundation/volatility3/issues/413 具有同样问题, 等待软件后续更新解决把
1
2
3
|
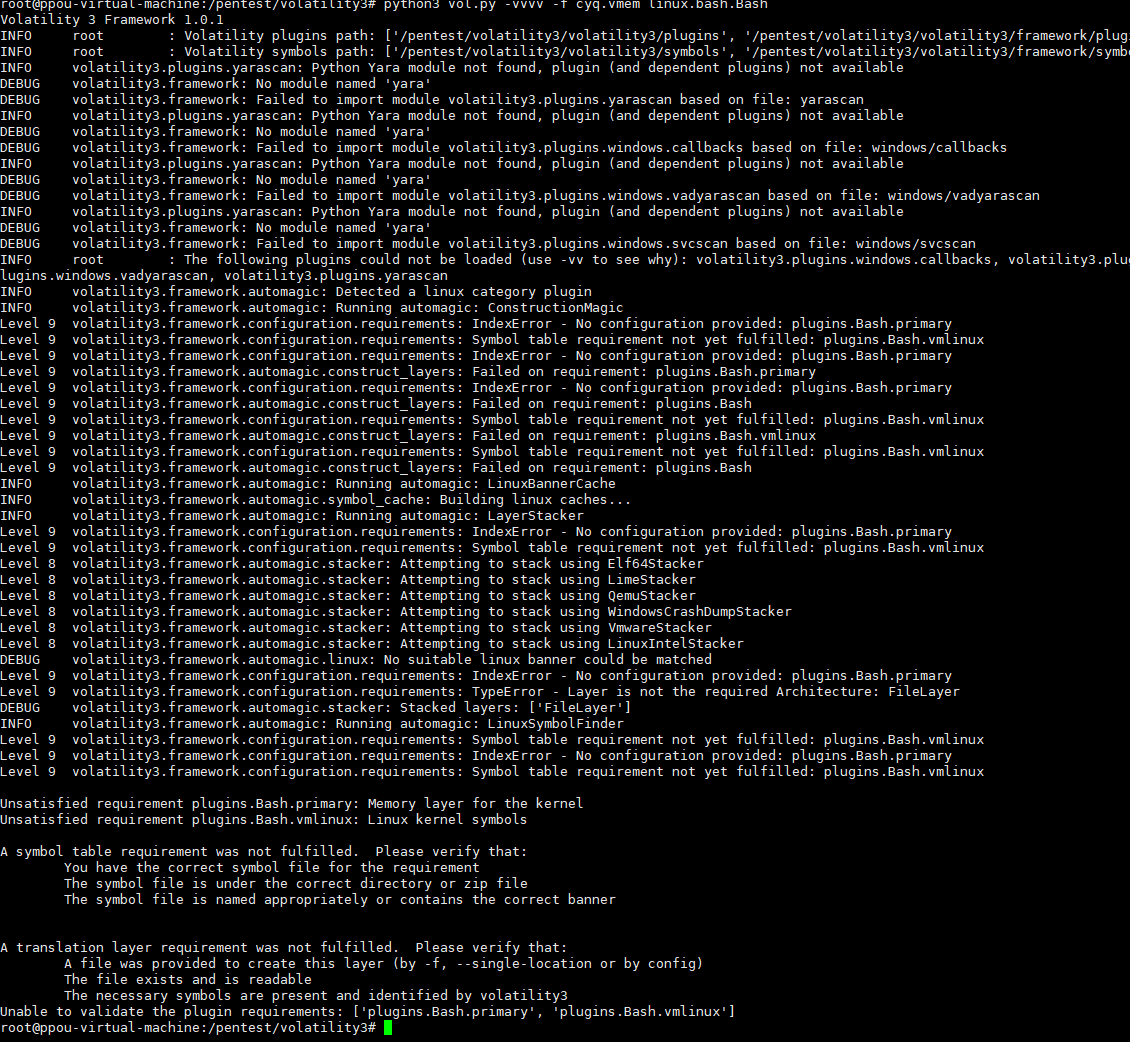
python3 vol.py -vvvv -f cyq.vmem linux.bash.Bash
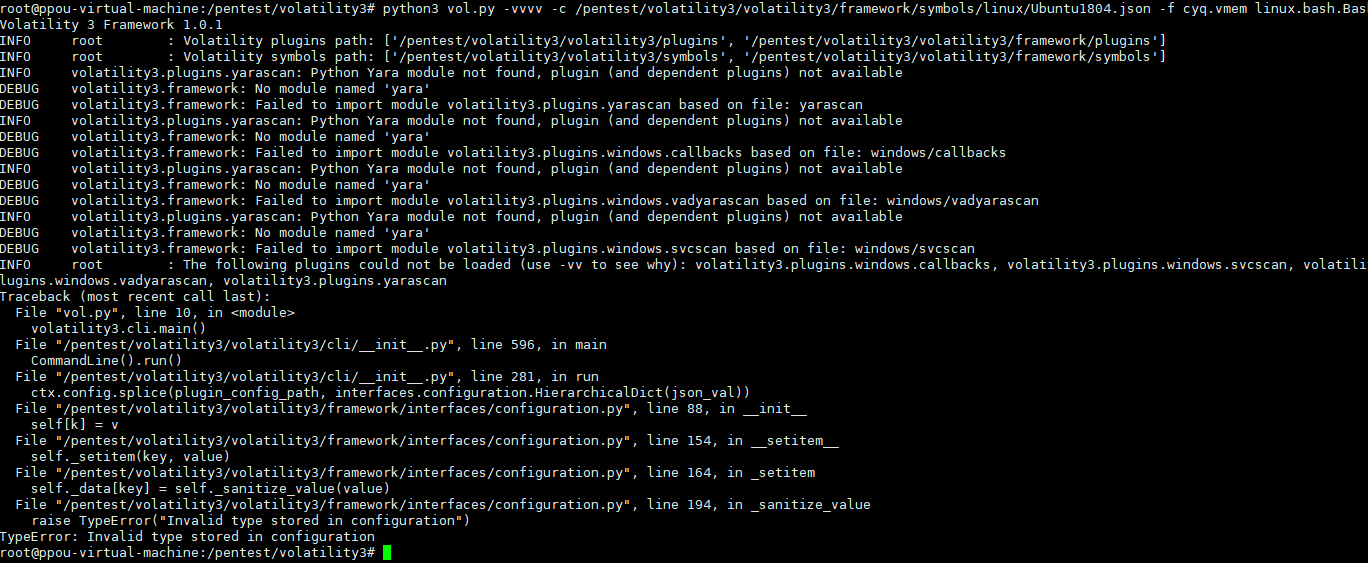
python3 vol.py -vvvv -c /pentest/volatility3/volatility3/framework/symbols/linux/Ubuntu1804.json -f cyq.vmem linux.bash.Bash
python3 vol.py -vvvv -s volatility3/framework/symbols/linux/ -f cyq.vmem linux.bash.Bash
|
以 CentOS7 为例
- 所使用的工具:
- f8x
- Lime
- Vmware Workstation
- volatility3
配置 centos7 系统并导出内存文件
1
2
3
|
内存:8G
CPU:2核
硬盘:40G
|
在 centos 虚机中安装 lime 工具
安装步骤比较简单,但是有几个坑点。
1
2
3
|
git clone https://github.com/504ensicsLabs/LiME.git
cd Lime/src
make
|
make 的时候可能会出现出现一点问题。
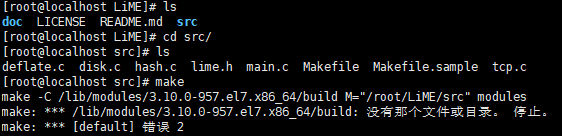
这个原因就是系统自身的内核版本和 kernel-devel 安装的内核不匹配,我这台安装的内核为 3.10.0-1160.15.2.el7.x86_64,但是使用 uname -r 查到的内核版本为 3.10.0-957.el7.x86_64,所以使用 yum upgrade 升级内核并重启即可解决。
重新编译会生成一个名字和内核版本相同的. ko 文件。
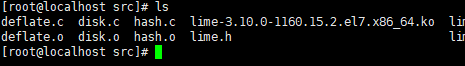
接下来使用 lime 工具导出内存文件.
1
|
insmod ./lime-3.10.0-1160.15.2.el7.x86_64.ko "path=/root/centos.lime format=lime"
|
“./” 后面输入刚刚生成的 .ko 文件
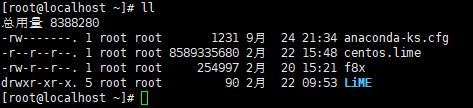
可以看到文件大小非常接近于8G。
制作 centos 符号表文件
制作 centos 的符号表文件需要用到一个使用 GO 语言编写的程序
根据项目说明,可以采用四种方式来生成符号表(json文件)。
这里我们就选用第一种。然而,使用第一种的话需要 vmlinux 文件,而这 centos 中原本是没有的,所以需要安装。
1
|
sudo debuginfo-install kernel
|
在安装完成之后可以查找 vmlinux 文件
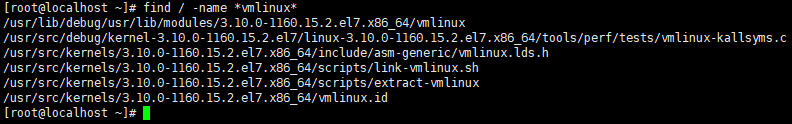
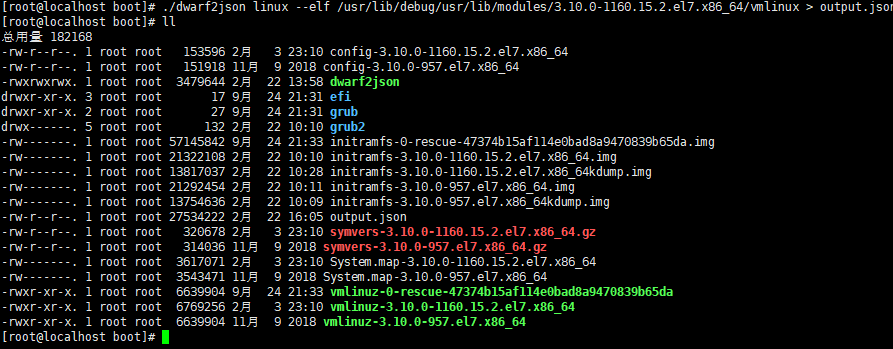
然后使用 dwarf2json 工具即可导出符号表文件。
kali 分析机 vol3 安装以及使用
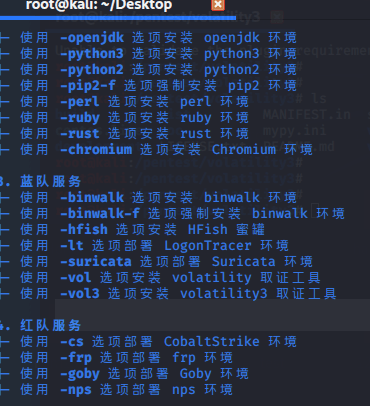
打开 kail,使用 f8x 一键安装 volatility3。
安装完毕后,在 /pentest/volatility3 可以找到它。
在 /pentest/volatility3/volatility3/symbols 中创建名为 “linux” 的文件夹,并把符号表放在里面。
把之前导出的 centos.lime 的内存文件也放入 kali 中。
使用 volatility 分析
1
|
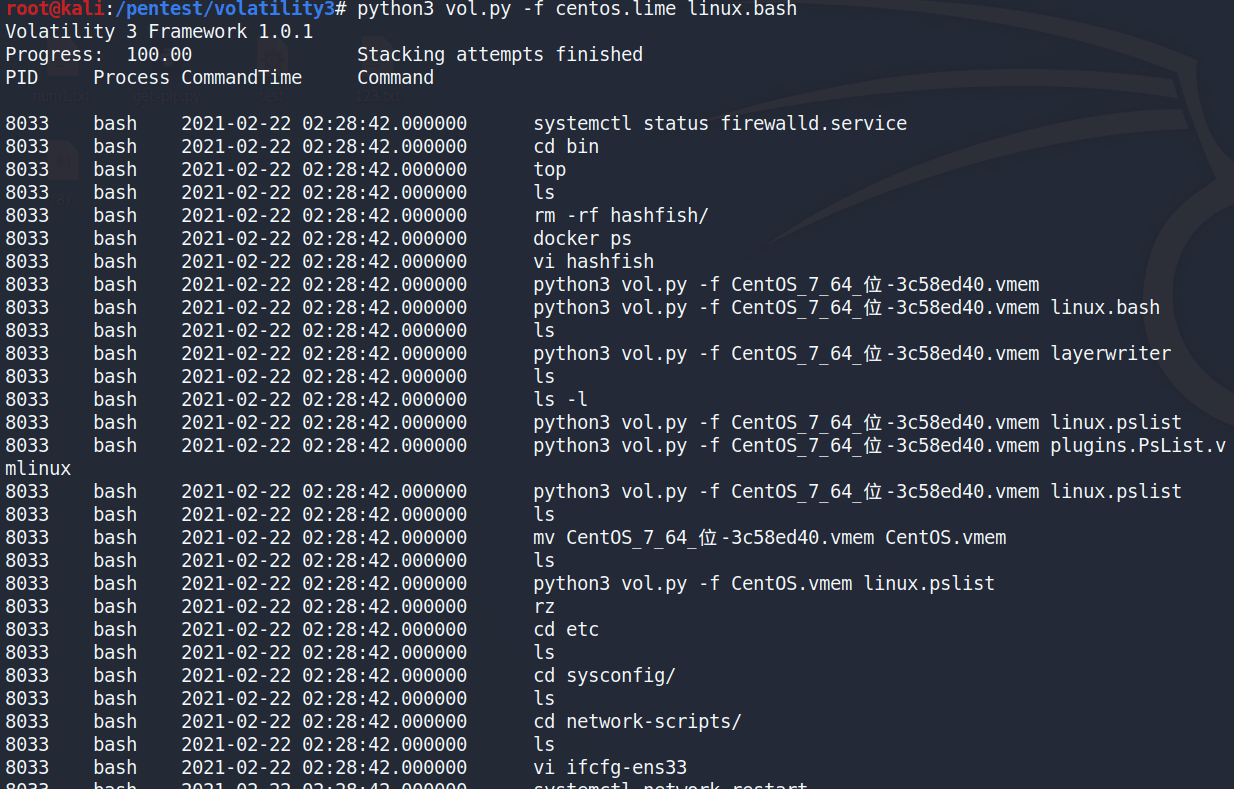
python3 vol.py -f centos.lime linux.bash
|
可以看到我在 centos 中所输入的历史命令
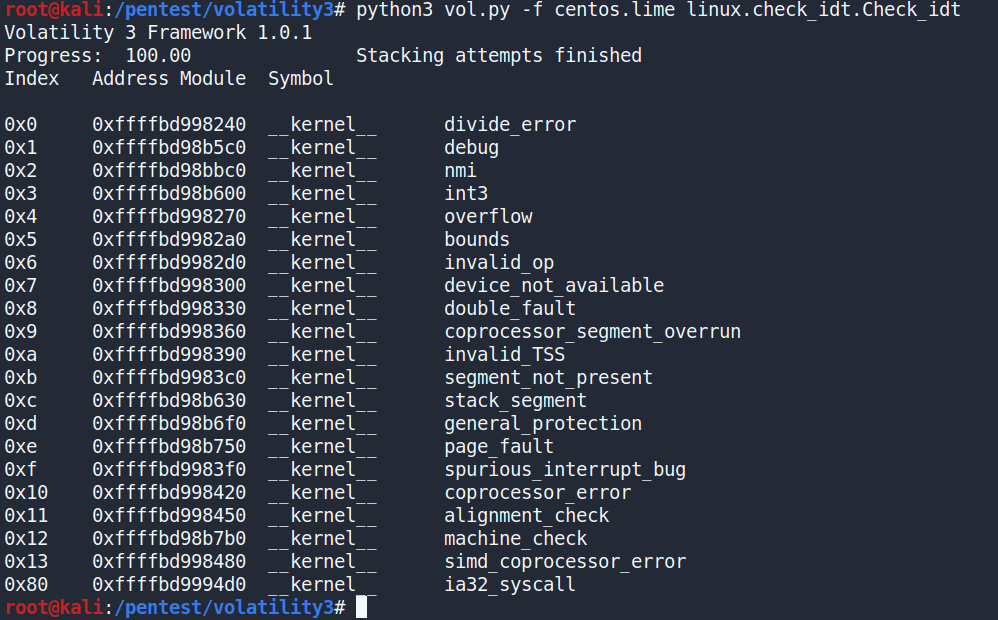
linux.check_idt.Check_idt
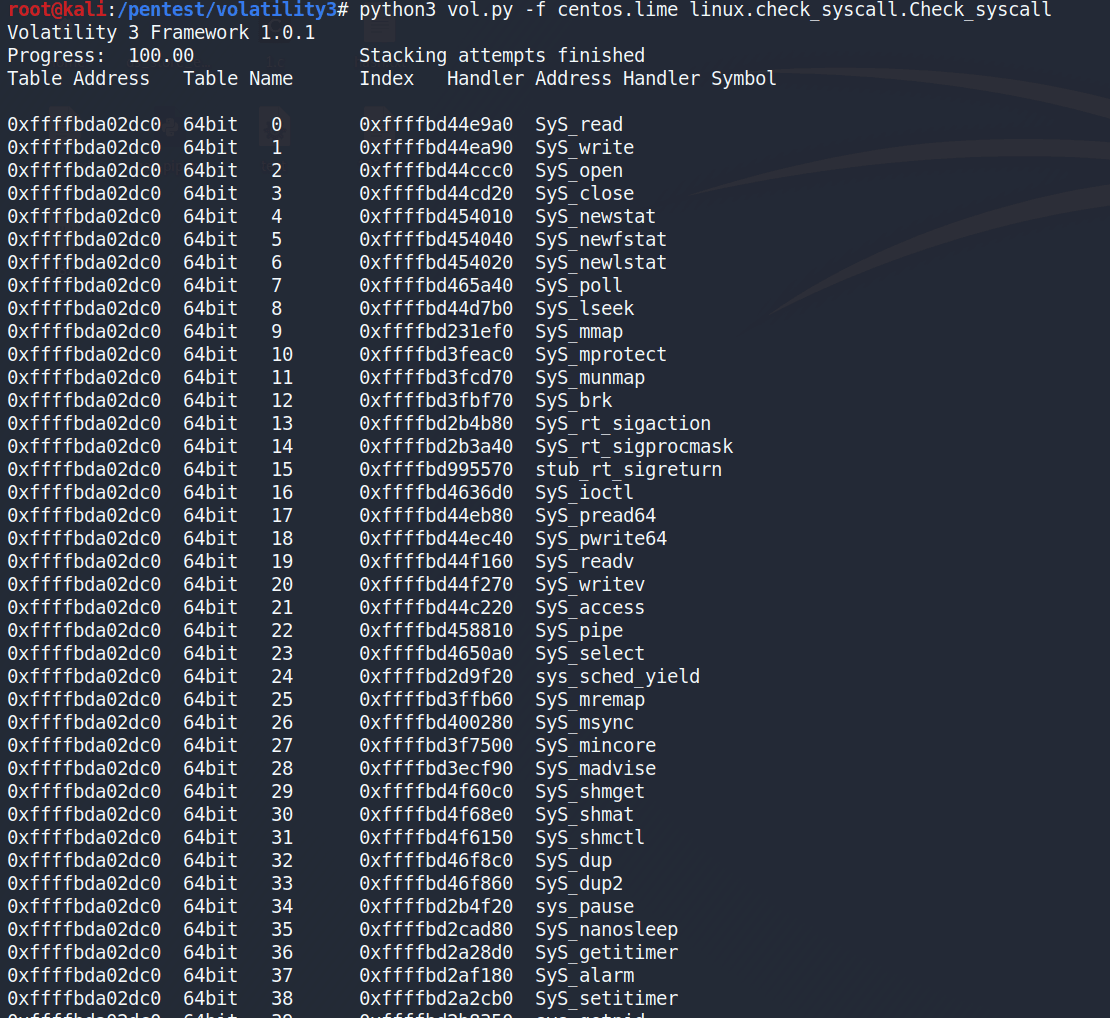
linux.check_syscall.Check_syscall
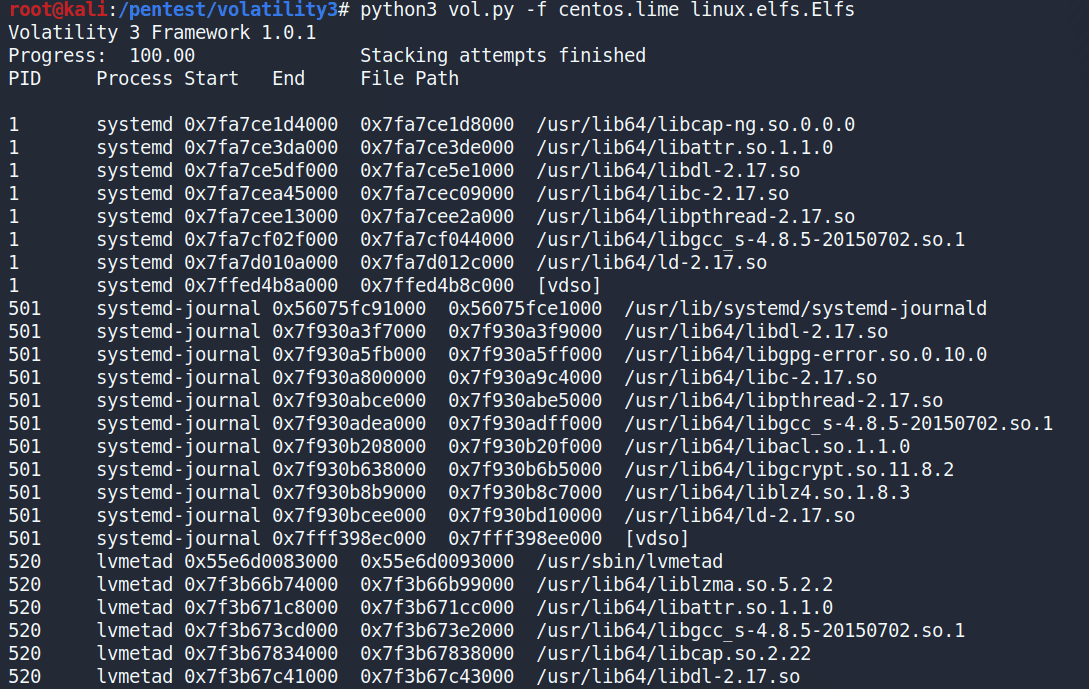
linux.elfs.Elfs
linux.lsmod.Lsmod

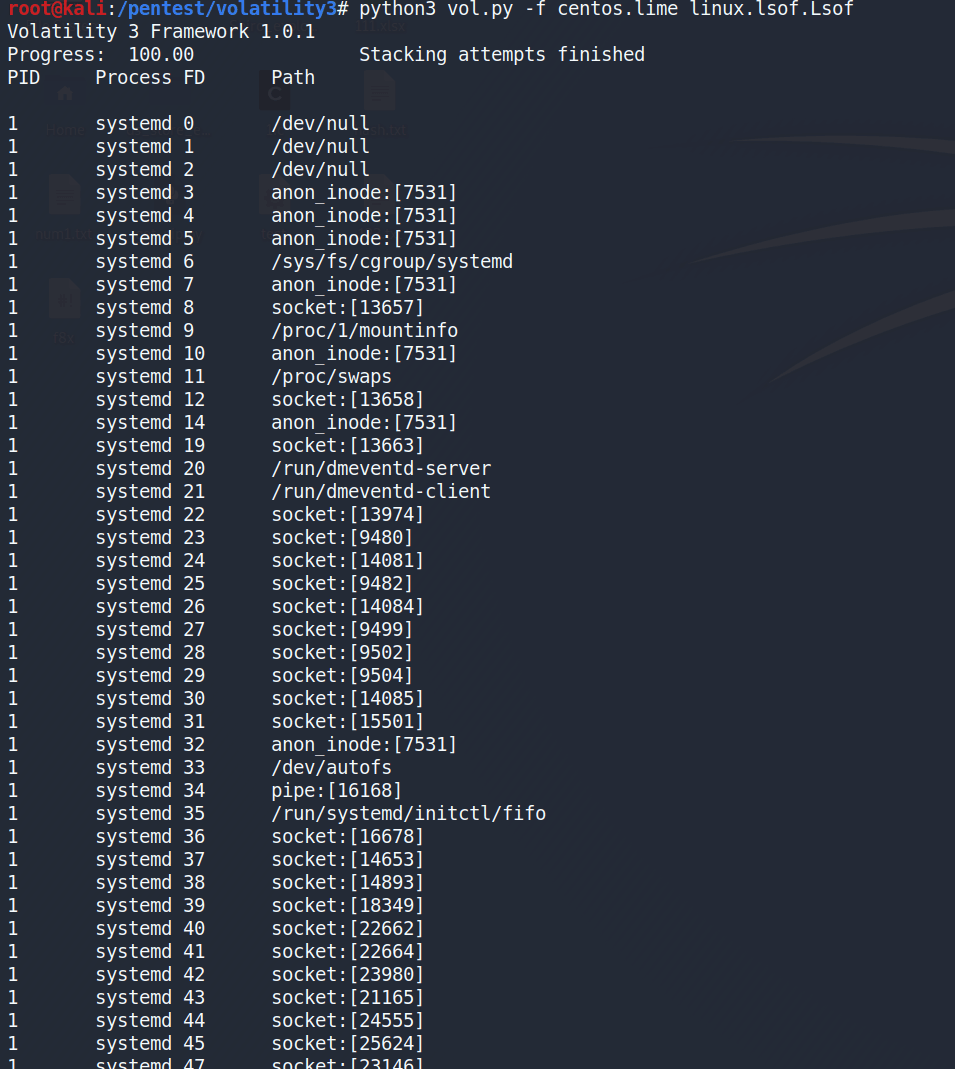
linux.lsof.Lsof
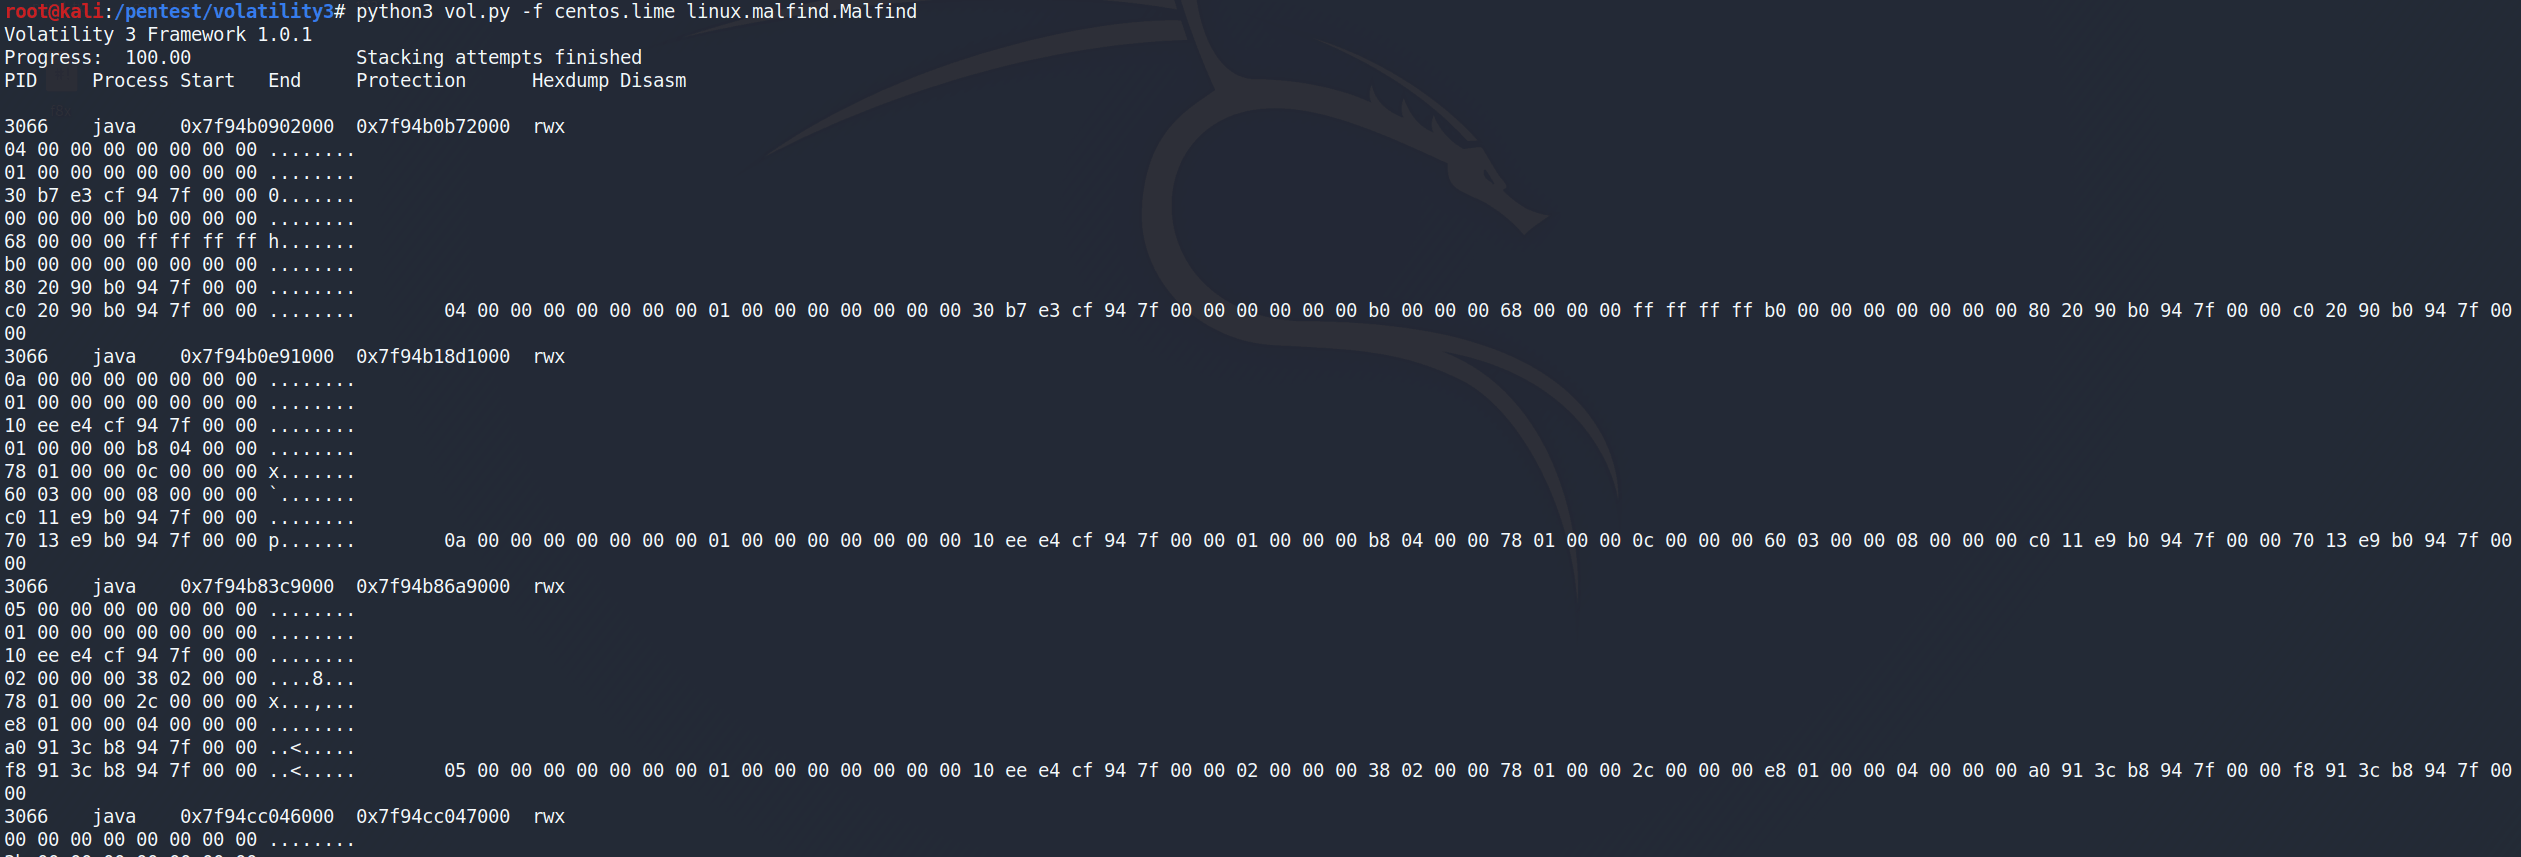
linux.malfind.Malfind
linux.proc.Maps
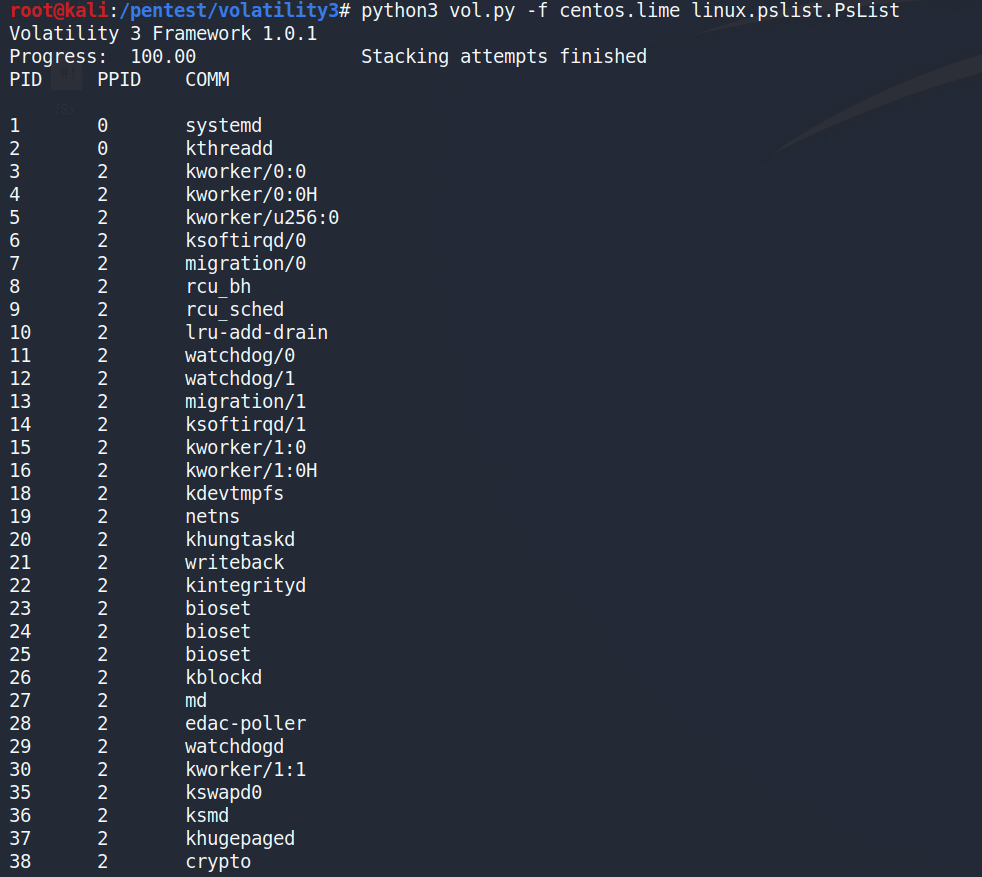
linux.pslist.PsList
linux.pstree.PsTree
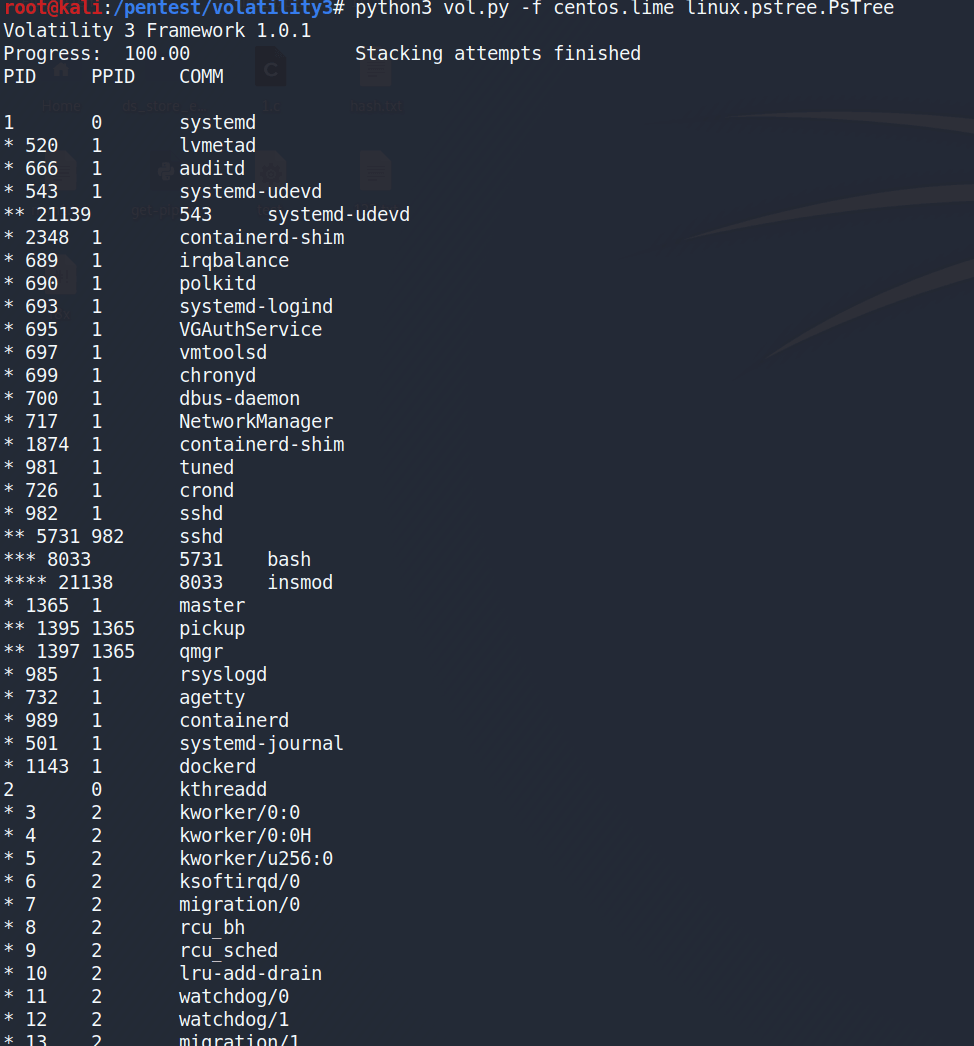
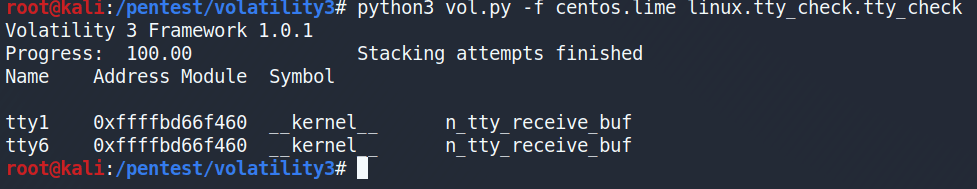
linux.tty_check.tty_check
文章作者 r0fus0d & Lorna Dane